
DebateGraph. Introduction. XML/SWF Charts is a simple, yet powerful tool to create attractive charts and graphs from XML data.
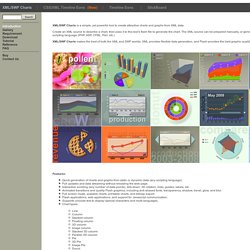
Create an XML source to describe a chart, then pass it to this tool's flash file to generate the chart. The XML source can be prepared manually, or generated dynamically using any scripting language (PHP, ASP, CFML, Perl, etc.) XML/SWF Charts makes the best of both the XML and SWF worlds. XML provides flexible data generation, and Flash provides the best graphic quality. Features: Quick generation of charts and graphs from static or dynamic data (any scripting language) Full updates and data streaming without reloading the web page. Testimonials I just wanted to pass along how well your script worked for our stock performance page. Good work! Create, share, and embed interactive charts online. Create Organizational Charts Online using Org Chart Software. Org Chart Software Packed with Features Our org chart specific features like filtering makes it super easy to add/remove fields from your entire org chart in 1 click.
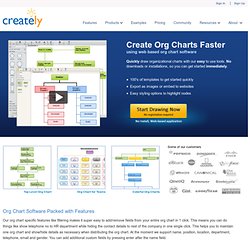
This means you can do things like show telephone no to HR department while hiding the contact details to rest of the company in one single click. This helps you to maintain one org chart and show/hide details as necessary when distributing the org chart. At the moment we support name, position, location, department, telephone, email and gender. You can add additional custom fields by pressing enter after the name field. Create Organizational Charts Online using Org Chart Software. Charts. Visual editor. Graphviz - Graph Visualization Software. Create A Pie Chart. Free! Creates a pie chart. You enter the amounts and titles for each slice of the chart! Create and design your own charts and diagrams online. JavaScript HTML5 Diagramming Library Component. Google Chart Generator di Luigi Provenza. yEd - Graph Editor. yEd is a powerful desktop application that can be used to quickly and effectively generate high-quality diagrams.
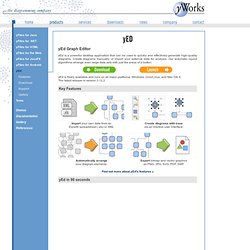
Create diagrams manually, or import your external data for analysis. Our automatic layout algorithms arrange even large data sets with just the press of a button. yEd is freely available and runs on all major platforms: Windows, Unix/Linux, and Mac OS X. The latest release is version 3.12.2 Key Features Import your own data from an Excel® spreadsheet (.xls) or XML. Sitemap Generator. Create UML diagrams online in seconds, no special tools needed. PlotKit. PlotKit is a Chart and Graph Plotting Library for Javascript.
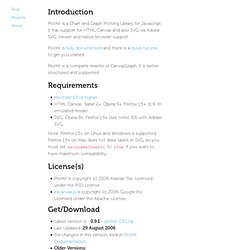
It has support for HTML Canvas and also SVG via Adobe SVG Viewer and native browser support. PlotKit is fully documented and there is a quick tutorial to get you started. PlotKit is a complete rewrite of CanvasGraph. Grapher. Brainstorm and mind map online. Mind Map Creation and Mind Mapping Software - bring thoughts to life. Flow Chart Maker & Online Diagram Software. Cacoo: Online Diagram Software for Flow Chart & UML and More. Tool - create barcharts graph online - free bar chart creation - download graph image webpage or report applet.
Education Oasis - Teaching Resources for Educators. Online Diagram Software and Flowchart Software - Gliffy. Dipity - Find, Create, and Embed Interactive Timelines. Mind Mapping Software - Create Mind Maps online. Tagxedo - Word Cloud with Styles. Create A Graph. Team WhiteBoarding with Twiddla - Painless Team Collaboration for the Web. TimeRime.com - Homepage. Chartle.net - interactive charts online! Timeglider: web-based timeline software. CiteULike: Everyone's library. Create Beautiful Looking Quotes Picture for Facebook, Google Plus, Wallpapers, E-cards, or even for Prints. QuotesCover.com. Piktochart: Infographic and Presentation Tool for Non-Designers. Popplet. Brainstorm and mind map online. Urturn. Create and share visual ideas online. Popular mind maps - Mind42. Motivator: Create your own motivational posters! Solutoire.com. Some time ago I was looking for a charting framework for Prototype and I couldn’t find it, just because there’s none.

So that’s where it all started. I came across PlotKit, a well written piece of javascript that enables developers to use Canvas or SVG elements for rendering bar, line and pie charts. The only thing was that PlotKit needed the Mochikit library to work. So I took some parts of PlotKit and wrote some parts myself. The result is a lightweight charting framework (12kb!) Plotr v0.2.0 License Plotr © 2007 Bas Wenneker. Browser support Firefox 1.5+Safari 2.0+Opera 9.0+IE6+ (emulated) Canvas HTML is emulated by ExplorerCanvas, a javascript that let’s you handle VML the same way as HTML Canvas. I’m testing Plotr with the following browsers: Safari 2.0.4, Opera 9.10, Firefox 2.0.0.1, IE6 and IE7. Requirements Download Example Getting started Documentation Yay, this seems to be quite easy!
Bugs, enhancements etc. Make Seating Charts Online. Diagram software. Add Gadget to Your Webpage. Online graphing calculator and function plotter. Infographics & Data Visualization. Make Your Images Interactive - ThingLink. Preceden - Make an amazing timeline in minutes. Historypin. Beautiful web-based timeline software. Creaza. Mindomo is an online mind mapping tool for visual learning, improving creativity and problem solving.

With Mindomo, you can organise and get an overview of thoughts, ideas, links, and other information visually. In order for the brain to remember what you learn, knowledge needs to be categorized. To make the learning process easier and more fun, you can use the mind map tool to make a map of your thoughts and sort them thematically. The mind map is well suited for exploring new material, looking at connections between new and known knowledge, and organizing material for further development. In addition to text, you can also add links and media files to your mind maps in Mindomo: Add pictures from Flickr, Google, Bing or Wikipedia Add film from YouTube, Vimeo, Creaza or your own productions Record sound Add sound clips from Creaza or your own productions Export to picture formats. Flowchart Software - Online Flow charts software service with Realtime collaboration [2.4-rlive, updated 2013/06/06 22:27 UTC]
OWTChart.MapTools.org. A Draw Anywhere - easy online diagramming, flow chart. Create A Graph. Create free online charts with online chart builder ChartGizmo.com - Use our chart software for visualizing your data. Chart Demo (WebFX) Explore and Create Free Timelines. TimeRime.com - Homepage. Simple, Collaborative Notetaking. Squareleaf. AXXT - Web development and more » Ajax MGraph. Stixy: For Flexible Online Creation Collaboration and Sharing.
Online Charts Builder. Hohli Online Charts Builder New version: Try new version of Charts Builder, it based on new Google Charts API Load From Image URL: Chart Data can't equal to original, but very similar to it.

Visualize Everything. Free online mind mapping software. Online diagramming application. Chartle.net - interactive charts online! Scriblink - Your Online Whiteboard. Whiteboard. Online Chart Generator. DIY Chart Builder - Free online create and design charts and graphs. Chartle.net - interactive charts online!
ChartGo - Online Graphing Fast, Easy and Free. Chartpart.com chart generator. Text 2 Mind Map - Simple mind mapping online. WordItOut - Generate word clouds (and make custom gifts) Tagul - Gorgeous tag clouds. JS Charts - Free JavaScript charts. Pie Chart Maker Online. Create a pie chart - Piecolor. Charts. CSS Chart Generator - create CSS Charts on the fly! Below you can enter all the necessary information for your chart.
The single items are explained and predefined, so you can simply start changing values. When you are done adding your values, simply click the send button and your chart will be generated in no time and you will receive a link which you can use to display the chart on your page. Please note, the animation effect is not included, but you can download the necessary ajax code. The free version shows a copyright notice in the x-axis title, while the pro version is free from any backlinks or ads and has much more functionality. It has not the ability to use gradient images or any other cool stuff. We have pre-filled the fields, so simply hit the send off button to create a demo chart. The color fields can use short notation of CSS HEX color values. As soon as you are finished adding values, colors, etc, and you press ok, your chart will appear here. Demo of a PRO chart. Diagrammr. Keep Calm Studio: Generator for custom Keep Calm and ... posters - Use the Keep Calm Poster maker to be creative » Keep Calm Studio.