
Unlocking the Future of Work: Don’t Let the Future Happen to You. [Featured] présentations. Les attentes des consommateurs Francais en 2012. 50 Powerful Statistics About Tech Mega Trends Affecting Every Business. The Digital Universe 2013 - New Zealand. 10 lessons-of-innovation-idris-mootee-keynote3950-120810010446-phpapp02. Ideation and Social Entrepreneurship in Latin America. Time is Life. Life is Time. 10 Tactics to Turn Your Content Marketing up to Eleven - Canadian Edition. We Built It, And They Didn’t Come! The Future of Search: Dispersed Citation & The Idea Graph. [Featured] présentations. 8 Creative content marketing tactics to boost your brand. 10 Surprising social media statistics that migh... Mobile Marketing Psychology. Mobile as a marketing channel is definitely on the move.

A Pew Research study reported that 56% of U.S. adults now own smartphones. Smartphone usage is highest among younger, better educated and more highly paid Americans. They represent the very consumers often targeted by retailers, insurance carriers and financial services providers. It’s important for mobile marketers to get it right the first time. Studies by social scientists confirm the old adage, “First impressions last.” How can mobile marketers get it right the first time? A key factor is having people with the right knowledge base working on mobile e-commerce sites and advertising.
Setting the right mood Clearly, goal and reward seeking is a major motivator for anyone using a smartphone in shopping. Mobile websites that facilitate this accomplish an important objective. Calming fear of loss Consumers naturally seek to avoid loss and reduce risks. Many who regularly shop online may hesitate to do it on their smartphones. Simon Sinek : inspirer l'action. Hype cycle. The Hype Cycle is a branded graphical presentation developed and used by IT research and advisory firm Gartner for representing the maturity, adoption and social application of specific technologies.
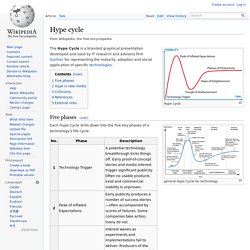
Five phases[edit] general Hype Cycle for technology Each Hype Cycle drills down into the five key phases of a technology’s life cycle. The term "Hype Cycle" and each of the associated phases are now used more broadly in the marketing of new technologies. Hype in new media[edit] Hype in new media (in the more general media sense of the term "hype"[1]) plays a large part in the adoption of new media forms by society.
Many analyses of the Internet in the 1990s featured large amounts of hype,[2][3][4] which as a result created "debunking" responses toward the Internet.[1] However, such hype and the negative and positive responses toward it have now given way to research that looks empirically at new media and its impact. Technology readiness level. NASA Technology Readiness Levels Technology readiness levels (TRLs) are measures used to assess the maturity of evolving technologies (devices, materials, components, software, work processes, etc.) during its development and in some cases during early operations.
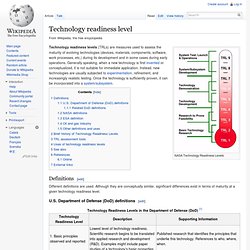
Generally speaking, when a new technology is first invented or conceptualized, it is not suitable for immediate application. Instead, new technologies are usually subjected to experimentation, refinement, and increasingly realistic testing. Once the technology is sufficiently proven, it can be incorporated into a system/subsystem. Definitions[edit] Different definitions are used. Cheap shots at the Gartner Hype Curve. The Gartner Hype curve, or Hype cycle, summarizes the visibility and the maturity of currently hot technologies and forecasts the productivity they will have.

At both of the workshops in CASCON that I went to, presenters showed us the most current curve, pointing out that web 2.0 is currently at the “peak of inflated expectations”. They claim we should expect it to descend to the “trough of disillusionment”, only to see it triumph in its recovery through the “slope of enlightenment” and, ultimately, the “plateau of productivity” (click on the image for a better view).
Apparently, this curve is the distillation of thousands of hours of work of expert forecasters and technologists. This is expensive work – the Gartner Group charges US$495 for a 16 page document that helps to understand it. Irrational optimism: The curve tells you that, no matter how wacky your technology is, and how unachievable its goals, after it fails to live up to its hype things are gonna get better, always! Google Analytics. Creating your own fancy infographics is not always easy, especially if you don’t know a whole lot about design.

Thanks to Visual.ly’s new tool for Google Analytics, you won’t have to do a whole lot to turn your Google Analytics data into an infographic. Just sign in on the site, and you are set. Log on to Visual.ly to start creating infographics using your Google Analytics data. Another great service by these folks. Submit your own infographics.