
Using Gephi with Google Analytics to visualize keywords and landing pages. As of late, I've been playing a lot with data analysis and visualization tools.

Recently I've read two interesting books (Statistical Analysis with R and Visualize This: The FlowingData Guide to Design, Visualization, and Statistics ) and I'm on my way to another two to refresh my statistics knowledge. But this post is only mildly related to these books, since it started way before: the day I read about Gephi.
Gephi is an open source graph visualization tool, to work with huge (or at least very big) datasets and graphs. A directed graph is a graph with arrows. Keywords (arrow) Landing pages What interesting things you can read from such a graph Clustering: In this particular instance, I can find the "clusters" of my blog. Step by step guide I'll assume that you can manage to download and install gephi on your own, and have some knowledge of Google Analytics. Then select Show Rows and select 500: And get a nice CSV file with the export tab on top: Remove the last line with dashes. Oops! Learn how to use Gephi. Welcome to Gephi!

Gephi is an open-source software for visualizing and analysing large networks graphs. Gephi uses a 3D render engine to display graphs in real-time and speed up the exploration. You can use it to explore, analyse, spatialise, filter, cluterize, manipulate and export all types of graphs. Getting Started New to Gephi? Quick Start Guide Supported Graph File Formats Official Tutorials Gephi is really easy to handle if you learn the basics.
Popular Tutorials by the Community: Various Tutorials in Video: Non-English Tutorials: In French: In Spanish: In Chinese: 介绍 Gephi 的各项主要操作方法。 Datasets Let's download and try some datasets available on the wiki, like C.elegans brain network or the web mapping study EuroSiS for the European Union. Practical cases A Twitter tag, #madewithgephi, has been adopted to tell when Gephi was used. Facebook group Many experienced users can provide help on this group. Forum New users are welcome to post questions at the Gephi Support Forums. Wiki. Netvizz – facebook to gephi. Since I have started to play around with the latest (and really great, easy to use) version of the gephi graph visualization and analysis platform, I have developed an obsession to build .gdf output (.gdf is a graph description format that you can open with gephi) into everything I come across.

The latest addition is a Facebook application called netvizz that creates a .gdf file describing either your personal network or the groups you are a member of. There are of course many applications that let you visualize your network directly in Facebook but by being able to download a file, you can choose your own visualization tool, play around with it, select and parameter layout algorithms, change colors and sizes, rearrange by hand, and so forth. Toolkits like gephi are just so much more powerful than Flash toys… my puny facebook network - gephi can process much larger graphs Update: v0.2 of netvizz is out, allowing you to add some data for each profile. Gephi facebook « Search Results. To corrupt a well known saying, “cook a man a meal and he’ll eat it; teach a man a recipe, and maybe he’ll cook for you…”, I thought it was probably about time I posted the recipe I’ve been using for laying out Twitter friends networks using Gephi, not least because I’ve been generating quite a few network files for folk lately, giving them copies, and then not having a tutorial to point them to.
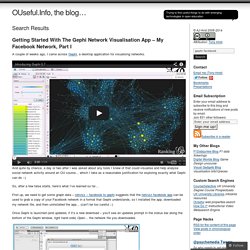
So here’s that tutorial… The starting point is actually quite a long way down the “how did you that?” Chain, but I have to start somewhere, and the middle’s easier than the beginning, so that’s where we’ll step in (I’ll give some clues as to how the beginning works at the end…;-) Here’s what we’ll be working towards: a diagram that shows how the people on Twitter that @wiredUK follows follow each other: The tool we’re going to use to layout this graph from a data file is a free, extensible, open source, cross platform Java based tool called Gephi. Import the file as a Directed Graph: Got that?!