Forecasts and ggplot. The forecast package uses the base R graphics for all plots, but some people may prefer to use the nice graphics available using the ggplot2 package.

In the following two posts, Frank Davenport shows how it can be done: To leave a comment for the author, please follow the link and comment on his blog: Research tips » R. R-bloggers.com offers daily e-mail updates about R news and tutorials on topics such as: visualization (ggplot2, Boxplots, maps, animation), programming (RStudio, Sweave, LaTeX, SQL, Eclipse, git, hadoop, Web Scraping) statistics (regression, PCA, time series, trading) and more... Regression – covariate adjustment. Linear regression is one of the key concepts in statistics [wikipedia1, wikipedia2].
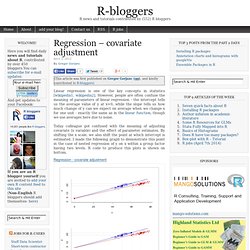
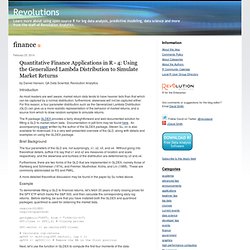
However, people are often confuse the meaning of parameters of linear regression - the intercept tells us the average value of y at x=0, while the slope tells us how much change of y can we expect on average when we change x for one unit - exactly the same as in the linear function, though we use averages here due to noise. Today colleague got confused with the meaning of adjusting covariate (x variable) and the effect of parameter estimates. By shifting the x scale, we also shift the point at which intercept is estimated. I made the following graph to demonstrate this point in the case of nested regression of y on x within a group factor having two levels.
R code to produce this plots is shown on bottom. Sixty two-minute r twotorials now available. Sixty twotorials now posted. two minutes each. new video highlights: purpose.of.twotorials.com <- ifelse( you are not yet fluent in the r language , help you learn more , provide quicklinks to answer colleagues' r questions ) here's a video that no one who has ever seriously used r would need - but might find useful to send along with syntax that a newbie needs to run for some reason: 041 did someone send you a script file or computer code for the r programming language?

Here's how to run it! Using R for Analyzing Loans, Portfolios and Risk: From Academic Theory to Financial Practice. Data science, machine learning, and analytics have re-defined how we look at the world.
The R community plays a vital role in that transformation and the R language continues to be the de-facto choice for statistical computing, data analysis, and many machine learning scenarios. The importance of R was first recognized by the SQL Server team back in 2016 with the launch of SQL ML Services and R Server. Over the years we have added Python to SQL ML Services in 2017 and Java support through our language extensions in 2019. Earlier this year we also announced the general availability of SQL ML Services into Azure SQL Managed Instance.
SparkR, sparklyr, and PySpark are also available as part of SQL Server Big Data Clusters. With that said, much has changed in the world of data science and analytics since 2016. Today we are making the following announcements to clearly state our direction and intent for R within Azure SQL and SQL Server. User Input in R vs Python. Both R and Python have facilities where the coder can write a script which requests a user to input some information.
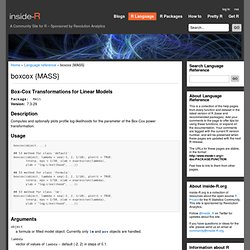
"Correlation / Covariance" Spectrum (This time with "R") I treat this matter with other software´s, and of course you can do the same with "R".Once I have the spectra of my samples with a math treatment, I want to draw a correlation spectrum to see which wavelengths have better correlation with the constituent of interest.
In this example I want to see the correlation of the wavelengths treated with MSC (Multiple Scatter Correction) respect to the Moisture value of the Demo file, but only in the NIR range (1100 to 2498 nm = 700 data points). >Xmsc<-demoNIR_msc$NIRmsc>Ymoi<-demoNIR_msc$Moisture>cor_spec<-cor(Ymoi,Xmsc[,1:700])>matplot(wave_nir,t(cor_spec),lty=1,pch="*", R: Functions for extreme value distributions. Finance. By Daniel Hanson, QA Data Scientist, Revolution Analytics Introduction and Data Setup Last time, we included a couple of examples of plotting a single xts time series using the plot(.) function (ie, said function included in the xts package).
Today, we’ll look at some quick and easy methods for plotting overlays of multiple xts time series in a single graph. As this information is not explicitly covered in the examples provided with xts and base R, this discussion may save you a bit of time. To start, let’s look at five sets of cumulative returns for the following ETF’s: SPY SPDR S&P 500 ETF TrustQQQ PowerShares NASDAQ QQQ TrustGDX Market Vectors Gold Miners ETFDBO PowerShares DB Oil Fund (ETF)VWO Vanguard FTSE Emerging Markets ETF We first obtain the data using quantmod, going back to January 2007: library(quantmod)tckrs <- c("SPY", "QQQ", "GDX", "DBO", "VWO")getSymbols(tckrs, from = "2007-01-01") Using R for Analyzing Loans, Portfolios and Risk: From Academic Th... Optimization and Mathematical Programming.
Boxcox {MASS} Box-Cox Transformations for Linear Models Description Computes and optionally plots profile log-likelihoods for the parameter of the Box-Cox power transformation.
Usage. Sem. OpenMx - Advanced Structural Equation Modeling. Lavaan. Forecast {forecast} Description forecast is a generic function for forecasting from time series or time series models.