
Itzikkotler: So, I have decided to pack... Writing kernel exploits. Libo 0.1 released - Xi Wang. Flash_ASLR_bypass. Heap Overflows For Humans 104. Created by mr_me on Sunday the 11 of March, 2012 Tags: heap, exploitation.
Heap Overflows For Humans 103. Created by mr_me on Thu Jan 05 03:17:43 +1100 2012 Tags: bitmap attacks, bitmap flip, eip, exploit development, FreeListInUse, heap determinism, heaper, management structures, reversing, RtlCommitRoutine Hi guys!
Once again I'm back and here to discuss yet another important technique for heap exploitation that I do not want to see get buried in the sands of time. Lucky for me I have some time off over Christmas/New years so I can cover more of this topic. Lets review what we have covered so far just in-case you missed some if it: Integer Overflow Paper. My coauthors and I just finished the final version of our paper about integer overflows in C/C++ programs that’s going to appear at ICSE 2012, a software engineering conference.
The world's leading source for technical x86 processor information. Vulnerability analysis, Security Papers, Exploit Tutorials. ROPgadget tool v3.3. By Jonathan Salwan - 2011-03-12 Description This tool lets you search your gadgets on your binaries (ELF format) to facilitate your ROP exploitation.
Since version 3.0, ROPgadget has a auto-roper for build your payload automatically with the gadgets found. Introduction to Writing Shellcode. BinDiff. Zynamics BinDiff uses a unique graph-theoretical approach to compare executables by identifying identical and similar functions Description BinDiff is a comparison tool for binary files, that assists vulnerability researchers and engineers to quickly find differences and similarities in disassembled code.
DarunGrim: A Patch Analysis and Binary Diffing Tool. Scriptable version of DarunGrim3. Simple shellcode obfuscation. This article aims to provide you with the different steps needed to develop shellcode obfuscation techniques, and their respective deobfuscator assembly stubs.
This should help you to learn a bit more about IDS and Anti-Virus evasion techniques, and more than that, to give you a useful template to create more advanced obfuscations stuffs. Don’t be confused, we are not talking about shellcode “encoders” since we do neither modify the opcodes nor remove any bad characters. MSF-AV-Sandbox [pdf] Heaper.py at master from mrmee/heaper - GitHub. Si - Visualizing entropy in binary files. Last week, I wrote about visualizing binary files using space-filling curves, a technique I use when I need to get a quick overview of the broad structure of a file.
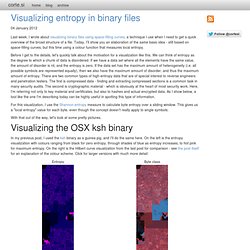
Today, I'll show you an elaboration of the same basic idea - still based on space-filling curves, but this time using a colour function that measures local entropy. Before I get to the details, let's quickly talk about the motivation for a visualization like this. We can think of entropy as the degree to which a chunk of data is disordered. If we have a data set where all the elements have the same value, the amount of disorder is nil, and the entropy is zero. If the data set has the maximum amount of heterogeneity (i.e. all possible symbols are represented equally), then we also have the maximum amount of disorder, and thus the maximum amount of entropy. Question: How does loader know ASLR is enabled for a binary? Most people know that ASLR randomizes the base address of the binary when loaded, but how does the loader know that a binary is ASLR capable?
This is a fairly easy question to answer but from what I can tell is rarely documented as a detection method and the subject of this post. I created a little ruby script to give you access to these values over your whole file system, directories, or a file. Spray / mem patterns visualizer. Heappie!
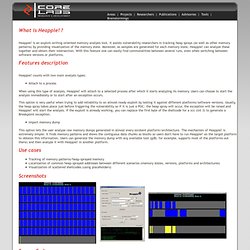
Is an exploit-writing-oriented memory analysis tool. It assists vulnerability researchers in tracking heap sprays (as well as other memory patterns) by providing visualization of the memory state. Hellman/libformatstr - GitHub. Intel Instruction Set. X86 Opcode and Instruction Reference 1.11. System Call Table. Linux System Call Table The following table lists the system calls for the Linux 2.2 kernel.
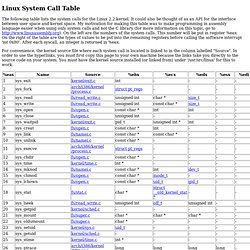
It could also be thought of as an API for the interface between user space and kernel space. My motivation for making this table was to make programming in assembly language easier when using only system calls and not the C library (for more information on this topic, go to On the left are the numbers of the system calls. This number will be put in register %eax. On the right of the table are the types of values to be put into the remaining registers before calling the software interrupt 'int 0x80'. For convenience, the kernel source file where each system call is located is linked to in the column labelled "Source".
Note for sys_ipc (117): this syscall takes six arguments, so it can't fit into the five registers %ebx - %edi; the last parameter (not shown) is of type 'long'. I will now explain exactly where in the kernel source that I got the information in the table above. System Call Numbers.