
Sigma.js. Community Detection Algorithms. Installing python-igraph on linux - igraph. This is part of the Installing python-igraph series.
This page describes the standard installation methods of the stable version, so you need to have administrator privileges on the computer. Algorithms — NetworkX 1.7 documentation. Creating a graph — NetworkX 1.7 documentation. Start here to begin working with NetworkX.
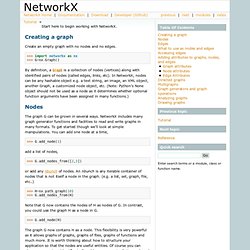
Create an empty graph with no nodes and no edges. >>> import networkx as nx>>> G=nx.Graph() By definition, a Graph is a collection of nodes (vertices) along with identified pairs of nodes (called edges, links, etc). In NetworkX, nodes can be any hashable object e.g. a text string, an image, an XML object, another Graph, a customized node object, etc. (Note: Python’s None object should not be used as a node as it determines whether optional function arguments have been assigned in many functions.)
How to create and use compressed (zipped) folders in Windows XP. This article describes how to create and use compressed ("zipped") folders in Windows XP.
Compressing files, folders, and programs decreases their size and reduces the space they use on your drives or removable storage devices. Additionally, this article discusses how to add items to and remove items from a compressed folder, and how to protect the folder by using a password. This article is intended for beginning to intermediate computer users. You may find it easier to follow the steps if you print this article first. Visualizing Adjacency Matrices in Python. Python - NetworkX write to file.
Taking R to the Limit (High Performance Computing in R), Part 2. Social Network Analysis for Startups > 4. Cliques, Clusters and Components > Block Models. Good Info on Graphs-- Jaccard similarity on. Www.cs.tau.ac.il/~roded/courses/bnet-a06/lec05.pdf. Social DynamicsSocial Dynamics. Students in my Kellogg MBA and EMBA Social Dynamics and Networks classes do a lot of work using the network analysis and visualization software package Gephi.

As with any unfamiliar software, there are often a few bumps along the road. I thought it would be helpful to compile a Gephi FAQ, so I scanned through my old emails looking for Gephi questions and have posted some of the most common ones here along with their answers. Q1. How can I filter the network so that I only see the largest connected component?
Force-Directed Layouts.
Dan's Intro Lab for SoNIA. Igraph.sourceforge.net/doc/R/igraph.pdf. Load and display a GEXF encoded graph. Build your own interactive network. Similar to the map builder, there is a web-based version of the network builder under development.
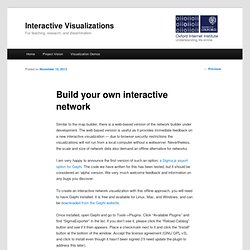
The web based version is useful as it provides immediate feedback on a new interactive visualization — due to browser security restrictions the visualizations will not run from a local computer without a webserver. Nevertheless, the scale and size of network data also demand an offline alternative for networks. I am very happy to announce the first version of such an option: a Sigma.js export option for Gephi.
The code we have written for this has been tested, but it should be considered an ‘alpha’ version. Social Network Analysis in R. Home » Lab table of contents To run the following labs install R (Linux, MacOS X or Windows) and execute the following command in R (this will download and install all needed packages and data): source(" Chapters.
Learn how to use Gephi. Welcome to Gephi!
Gephi is an open-source software for visualizing and analysing large networks graphs. Gephi uses a 3D render engine to display graphs in real-time and speed up the exploration. You can use it to explore, analyse, spatialise, filter, cluterize, manipulate and export all types of graphs. Getting Started New to Gephi? Quick Start Guide Supported Graph File Formats Official Tutorials Gephi is really easy to handle if you learn the basics. Popular Tutorials by the Community: Various Tutorials in Video: Non-English Tutorials: How to Make an Interactive Network Visualization. Networks!
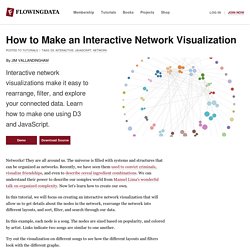
They are all around us. The universe is filled with systems and structures that can be organized as networks. Recently, we have seen them used to convict criminals, visualize friendships, and even to describe cereal ingredient combinations. We can understand their power to describe our complex world from Manuel Lima's wonderful talk on organized complexity. Now let's learn how to create our own. In this tutorial, we will focus on creating an interactive network visualization that will allow us to get details about the nodes in the network, rearrange the network into different layouts, and sort, filter, and search through our data. University. A network can consist of different 'classes' of nodes.
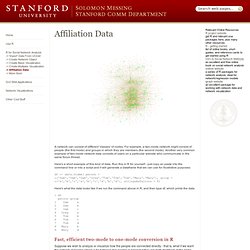
For example, a two-mode network might consist of people (the first mode) and groups in which they are members (the second mode). Another very common example of two-mode network data consists of users on a particular website who communicate in the same forum thread. Here's a short example of this kind of data. Run this in R for yourself - just copy an paste into the command line or into a script and it will generate a dataframe that we can use for illustrative purposes: df <- data.frame( person = c('Sam','Sam','Sam','Greg','Tom','Tom','Tom','Mary','Mary'), group = c('a','b','c','a','b','c','d','b','d'), stringsAsFactors = F) Here's what the data looks like if we run the command above in R, and then type df, which prints the data: > df person group1 Sam a2 Sam b3 Sam c4 Greg a5 Tom b6 Tom c7 Tom d8 Mary b9 Mary d.
Working with Bipartite/Affiliation Network Data in R. Data can often be usefully conceptualized in terms affiliations between people (or other key data entities).
It might be useful analyze common group membership, common purchasing decisions, or common patterns of behavior. This post introduces bipartite/affiliation network data and provides R code to help you process and visualize this kind of data. I recently updated this for use with larger data sets, though I put it together a while back. Preliminaries Much of the material here is covered in the more comprehensive “Social Network Analysis Labs in R and SoNIA,” on which I collaborated with Dan McFarland, Sean Westwood and Mike Nowak.