
Oleg Komissarov
Cloud-Based Portfolio Analysis with StatPro Revolution. Imagine a complete portfolio analysis and reporting platform available in the cloud, enabling you to create a wealth of highly sophisticated performance and risk analytics.

Imagine being able to share this analysis internally as well as with your clients, explaining how you are adding value to their portfolio, increasing transparency, improving oversight and building trust. Stop imagining. Grow your assets under management and stay competitive with StatPro Revolution. “A real game changer” John Benedict, J2 Capital Management Access highly visual and sophisticated levels of portfolio analysis all in one place, including performance ratios, equity and fixed income attribution, ex-ante risk and contribution.
Transform your client communication with interactive, visual analysis and reporting. Increase sales Distribute your analysis to anyone, securely over the web. Who is it for? Asset Managers Provide online portfolio analytics and reporting to your clients cost effectively. Where do I start? 6. Spring Expression Language (SpEL) The Spring Expression Language (SpEL for short) is a powerful expression language that supports querying and manipulating an object graph at runtime.

The language syntax is similar to Unified EL but offers additional features, most notably method invocation and basic string templating functionality. While there are several other Java expression languages available, OGNL, MVEL, and JBoss EL, to name a few, the Spring Expression Language was created to provide the Spring community with a single well supported expression language that can be used across all the products in the Spring portfolio. Its language features are driven by the requirements of the projects in the Spring portfolio, including tooling requirements for code completion support within the eclipse based SpringSource Tool Suite. That said, SpEL is based on a technology agnostic API allowing other expression language implementations to be integrated should the need arise.
Big Data. Roundup of Big Data Forecasts and Market Estimates, 2012. 16 Data Visualization Vendors are squared. Data Visualization "Quadrant" « Data Visualization. For many years, Gartner keeps annoying me every January by publishing so called “Magic Quadrant for Business Intelligence Platforms” (MQ4BI for short) and most vendors (mentioned in it; this is funny, even Donald Farmer quotes MQ4BI) almost immediately re-published it either on so-called reprint (e.g. here – for a few months) area of Gartner website or on own website; some of them also making this “report” available to web visitors in exchange for contact info – for free.
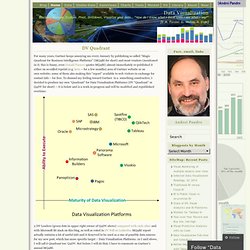
To channel my feeling toward Gartner to a something constructive, I decided to produce my own “Quadrant” for Data Visualization Platforms (DV “Quadrant” or Q4DV for short) – it is below and is a work in-progress and will be modified and republished overtime: 3 DV Leaders (green dots in upper right corner of Q4DV above) compared with each other and with Microsoft BI stack on this blog, as well as voted in DV Poll on LinkedIn.
Permalink: Like this: Like Loading... Data Visualization.