
Free Watermark. Add Custom Watermark. Protect Your Photos and Images - PicMarkr. Voki Home. ToonDoo - World's fastest way to create cartoons! What About Me? Infographics & Data Visualization. Venngage - Think with your eyes. Fast Analytics and Rapid-fire Business Intelligence from Tableau Software. StatPlanet World Bank - Open Data. Explore World Bank Data StatPlanet World Bank enables you to explore, analyze and filter any of the 8000+ indicators in the form of interactive maps and graphs, through the intuitive StatPlanet interface.
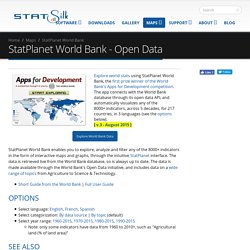
The data is retrieved live from the World Bank database, so is always up to date. The data is made available through the World Bank's Open Data initiative, and includes data on a wide range of topics from Agriculture to Science & Technology. Photo editor online - Pixlr.com edit image. Inkscape. Draw Freely. Online Charts Builder. Chart Tools. Online Diagram Software and Flowchart Software - Gliffy. Create and share visual ideas online. Create and share visual ideas online. Dipity - Find, Create, and Embed Interactive Timelines. About ChartsBin.com. Visual editor. INTERACTIVE DESIGN.
20+ Tools to Create Your Own Infographics. A picture is worth a thousand words – based on this, infographics would carry hundreds of thousands of words, yet if you let a reader choose between a full-length 1000-word article and an infographic that needs a few scroll-downs, they’d probably prefer absorbing information straight from the infographic. What’s not to like? Colored charts and illustrations deliver connections better than tables and figures and as users spend time looking back and forth the full infographic, they stay on the site longer. Create Easy Infographics, Reports, Presentations. Create infographics & online charts.
Easel.ly - create Infographics online. Block Posters - Create large wall posters from any image for free!