
StatsLife - news and opinion from the Royal Statistical Society. 6 maps that could change your perspective on the world. We don’t often question the typical world map that hangs on the walls of classrooms — a patchwork of yellow, pink and green that separates the world into more than 200 nations.
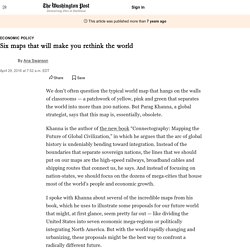
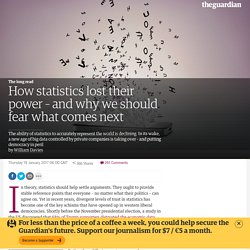
But Parag Khanna, a global strategist, says that this map is, essentially, obsolete. A Tactile Atlas Helps the Blind 'See' Maps. Some maps are meant to be felt, not seen.

The photograph above shows a page from an atlas commissioned by a Swiss psychologist for a friend who loves geography and maps but is unable to use traditional atlases because he is completely blind. The new atlas is printed with special ink that expands when heated to create tiny bumps and ridges on the page. Making a tactile map like this isn’t easy, says Anna Vetter, a cartographer who works in Zürich for the mapping software company Esri and led the team that created the new atlas. “It was quite challenging for me because you really have to think in a different way,” Vetter says. For example, Vetter used hatched lines to indicate railroad tracks, as you can see in the image below. She learned other lessons along the way, too. How statistics lost their power – and why we should fear what comes next. In theory, statistics should help settle arguments.
They ought to provide stable reference points that everyone – no matter what their politics – can agree on. Yet in recent years, divergent levels of trust in statistics has become one of the key schisms that have opened up in western liberal democracies. Shortly before the November presidential election, a study in the US discovered that 68% of Trump supporters distrusted the economic data published by the federal government. In the UK, a research project by Cambridge University and YouGov looking at conspiracy theories discovered that 55% of the population believes that the government “is hiding the truth about the number of immigrants living here”.
Rather than diffusing controversy and polarisation, it seems as if statistics are actually stoking them. Nowhere is this more vividly manifest than with immigration. All of this presents a serious challenge for liberal democracy. This is an unwelcome dilemma. Here’s a problem, though. 7 maps that will change how you see the world. A Japanese architect has won a prestigious award for creating a new map, because it shows the world as it really is.
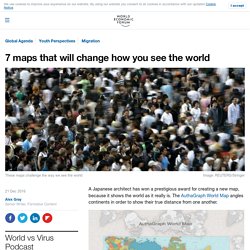
The AuthaGraph World Map angles continents in order to show their true distance from one another. Hajime Narukawa won the Good Design Award, beating over 1,000 entries in a variety of categories. See the Historic Maps Declassified by the CIA. Shortly after the attacks of September 11, 2001, U.S.
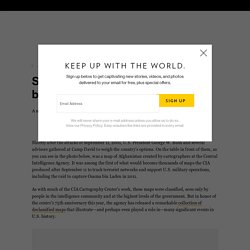
President George W. Bush and several advisors gathered at Camp David to weigh the country’s options. On the table in front of them, as you can see in the photo below, was a map of Afghanistan created by cartographers at the Central Intelligence Agency. It was among the first of what would become thousands of maps the CIA produced after September 11 to track terrorist networks and support U.S. military operations, including the raid to capture Osama bin Laden in 2011. Top 19 geovisualization tools, APIs and libraries that will let you create beautiful web maps. Creating a good web map is not an easy task but over the years we’ve seen plenty of amazing geovisualization examples.
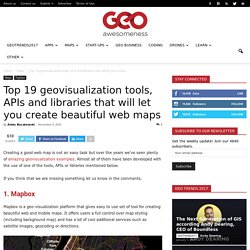
Almost all of them have been developed with the use of one of the tools, APIs or libraries mentioned below. If you think that we are missing something let us know in the comments. 1. Mapbox Mapbox is a geo-visualization platform that gives easy to use set of tool for creating beautiful web and mobile maps. CARTO previously known as CartoDB is the best platform for complex and dynamic geospatial data visualization and analysis. 3. The one million tweet map #onemilliontweetmap. AShortIntroductiontoQuantitativeGeography. Skills in Mathematics and Statistics in Geography and tackling transition. Quantitative Methods in Geography Making the Connections between Schools, Universities and Employers. World maps: Mercator, Goode, Robinson, Peters and Hammer. How Mapmakers Make Mountains Rise Off the Page.
The world’s most beautiful places are rarely flat.
From the soaring peaks of the Himalaya to the vast chasm of the Grand Canyon, many of the most stunning sites on Earth extend in all three dimensions. This poses a problem for mapmakers, who typically only have two dimensions to work with. Fortunately, cartographers have some clever techniques for creating the illusion of depth, many of them developed by trial and error in the days before computers. 22 maps that explore modern America. European Demography 2016. Ordnance Survey Blog Top 10 mapping moments in OS history - Ordnance Survey Blog. By David Henderson, Director of Products It’s been 225 years since OS was founded and 215 years since we published our first map.
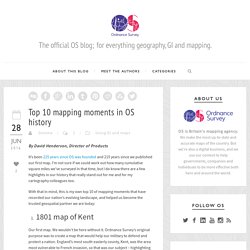
I’m not sure if we could work out how many cumulative square miles we’ve surveyed in that time, but I do know there are a few highlights in our history that really stand out for me and for my cartography colleagues too. With that in mind, this is my own top 10 of mapping moments that have recorded our nation’s evolving landscape, and helped us become the trusted geospatial partner we are today: The world map you know and love? It's been lying to you.