
HOME - Ecological Footprint - Ecological Sustainability. Ecological Footprint Quiz. Data Highlights - 32: By the Numbers – Data Highlights from Full Planet, Empty Plates. October 17, 2012.

Earth Dashboard. 5.97219E^21 MT (metric tons); <br><a href=" target="_blank">NASA, Solar System Exploration, Earth</a><br> Speed of Earth around Sun: 107,218 km/h; 66,622 mph.

<br><a href=" target="_blank">NASA, Solar System Exploration, Earth</a><br> Speed of Sun Around Galaxy: 13,200 km/h; 9,000 mph; <br> Speed of Galaxy: 2,156,459 km/h; 1.34 million mph <a href=" Physics Factbook</a> La fin programmée de la civilisation du gâchis. Réflection faite. De quoi est fait notre avenir? Quel avenir pour notre civilisation? Dates d'puisement des ressources naturelles de notre planète.
Nous vivons depuis longtemps sur la Terre, une accueillante petite planète d'un système stellaire parmi des milliards de milliards d'autres.
Dans un univers qui vient de rien (on parle de fluctuation du vide) et qui a explosé il y a 13,7 milliards d'années, d'après notre dernière datation. Nous en avons conscience et nous nous posons des questions essentielles. Qu'est-ce que la vie ? Est-elle extrêmement répandue dans notre galaxie et dans les cent milliards d'autres, répondant à des lois chimiques universelles ou bien est-ce un phénomène rarissime au point que la Terre soit finalement une exception dans l'univers, l'héritière d'une somme incalculable de hasards tous aussi improbables les uns que les autres ? Water footprint and virtual water.
2004 Global Clean Water Supply as % of Population - Google Fusion Tables. How Much Does it Buy? Corruption Perceptions Index. Indice de Pareto. Un article de Wikipédia, l'encyclopédie libre.

Définition[modifier | modifier le code] le revenu minimal de la population observée, la probabilité qu'un individu ait un revenu supérieur à est: où le paramètre est l'indice de Pareto. Distribution of wealth. World Distribution of Wealth and Population in the Year 2000 The distribution of wealth is a comparison of the wealth of various members or groups in a society.
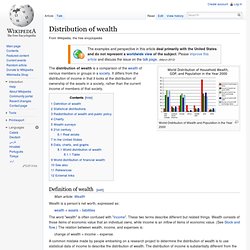
It differs from the distribution of income in that it looks at the distribution of ownership of the assets in a society, rather than the current income of members of that society. Definition of wealth[edit] Wealth is a person's net worth, expressed as: Data Visualization. World Bank Dataviz. The R Project for Statistical Computing. A Community Site for R – Sponsored by Revolution Analytics. Catégorie:Indicateur économique. If the world lived in a single city. Après le rapport Stiglitz, comment mesurer la richesse ?
Depuis plus d’une dizaine d’années, la sociologue Dominique Méda critique les insuffisances du PIB.

L’une des premières, elle a souligné l’incapacité de cet indicateur de richesse à tenir compte des inégalités, de la santé sociale et de la dégradation environnementale. La Vie des Idées a recueilli son analyse après la publication du rapport coordonné par Joseph Stiglitz, Amartya Sen et Jean-Paul Fitoussi. 5 Statistics Problems That Will Change The Way You See The World - Walter Hickey. Once the population of an office hits 366 people, it's a certainty that two people in your office have the same birthday, since there are only 365 possible days of birth.
Still, assuming that each birth date (except February 29) is equally likely, it turns out that once your office has 57 people in it there is a 99% chance that two of them share a birthday. When there is 23 people, that probability is 50%. Here's why. Instead of calculating the probability that two people share a birthday, instead calculate the converse, probability that two people don't share a birthday. Since these are mutually exclusive scenarios, first probability plus the second probability has to equal 1.
Here's how we figure this out, then. Economie : Stiglitz met l'individu au centre de l'économie. Le Figaro s'est procuré le rapport Stiglitz, qui doit être remis lundi au gouvernement.
Dans ce document, la mission prône un changement complet de méthode de calcul des richesses des pays. C'était en février 2008. Avant que le monde ne sombre dans le chaos de la crise du subprime. Autant dire une éternité. Nicolas Sarkozy installait à l'Élysée la commission Stiglitz, en lui confiant la mission d'identifier les limites du produit intérieur brut (PIB) comme indicateur de performance économique et de progrès social. Après dix-huit mois de travaux, leurs conclusions sont prêtes.
Revenir à des critères simples Cliquez sur l'aperçu pour agrandir l'infographie. Le rapport final de 291 pages, que Le Figaro s'est procuré dans sa version anglaise, préconise de revoir de fond en comble les modes de calcul de la croissance. Parmi les nombreuses pistes qu'elle étudie pour mieux décrire la réalité économique, la commission insiste plus particulièrement sur trois sujets. Daily News, Polls, Public Opinion on Politics, Economy, Wellbeing, and World. FAIR.
Plusieurs membres du FAIR ont été conviés individuellement à participer aux travaux des quatre réunions de la Commission de concertation sur les indicateurs complémentaires au PIB (Florence Jany-Catrice, Dominique Méda, Géraldine Thiry, Patrick Viveret) et ont assisté aux trois premières réunions (17 février, 3 mars, 17 mars).
L’objectif de cette Commission coprésidée par le CESE et France Stratégie est de « proposer un tableau de bord d’une dizaine d’indicateurs afin d’éclairer les décisions de politiques publiques. Ce tableau de bord pourrait notamment répondre aux attentes de la proposition de loi visant la prise en compte des nouveaux indicateurs de richesse dans la définition des politiques publiques, proposition de loi adoptée en première lecture par l’Assemblée nationale mercredi 29 janvier 2015. FAIR se réjouit de voir la thématique des nouveaux indicateurs de richesse progresser lorsqu’elle contribue à aller au-delà du PIB. Lire la suite... Commission sur la Mesure de la Performance Économique et du Progrès Social - Page d'accueil. Bottom of the Heap. SGI – Sustainable Governance Indicators 2011. Numerical Data Search.
Human Rights Maps.
Vision of Humanity. Statistic Brain. Slavery Footprint - Made In A Free World. Shadow Government Statistics : Home Page. Observatoire des sondages. Where In The World You Can Find The Best Schools — And The Happiest Kids. Annual Reviews - Home. Indicateurs & richesses.
Apps for Development. StatPlanet World Bank - Open Data. Institut national de la statistique et des études économiques : Accueil. World Values Survey. Portail de la statistique publique. L'encyclopédie de l'Etat du monde.