Le portail des territoires et des citoyens. Our Changing World. Mapping Proportional Geographical Data. Reading a blog post by Jon Udell just now - Visual numeracy for collective survival - I came across this question: What do you call th[e] kind of [map] projection, where country size is proportional to a variable?

What do you call something like this, for example? Any ideas? How would you search for it? I started off for a search on "proportional country map", and was lucky enough to soon hit upon an explanation by scanning through the search results: this type of map is called a cartogram, and it's one of several ways of using a map to depict the value of some particular measure or statistic. Visit the Worldmapper website, which hosts a collection of several hundred different cartograms (some of which are reprinted in The Atlas of the Real World: Mapping the Way We Live) and see if you can find cartograms that estimate the distribution of telephone lines across the world towards the end of the 20th century and in the early years of the 21st century. Understanding the Transformation of the Prospects of Place. Ville Vivante. Tornado tracks.jpg. The Scale of the Universe 2. Earth Atlas.
The Atlas of the Real World.
Space. NASA Earth Observatory : Home. High Resolution Imagery, Earth Imagery & Geospatial Services. An Imagery and Information Company. A Graphic Look at the State of the World - Earth Web Site. Worldmapper: The world as you've never seen it before.
TargetMap - Create & share customized data maps on Googlemaps. Free Online Mapping tool. OpenHeatMap. Geo-visualization. Home - ChartsBin.com. Thematicmapping.org. OpenStreetMap. Mapping Stereotypes Project by alphadesigner. Crazy Maps Show The World Organized By Human Activity.
Ever since Gerardus Mercator created his iconic map of the world in 1569--the one that first enabled ships to navigate at sea without getting lost--people have been drawing maps using the same fundamental concept of conveying physical space.
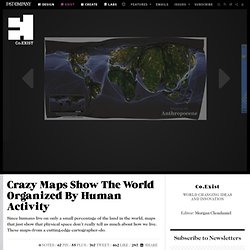
Cartographers have gotten more sophisticated over time. They’ve figured out how to distort that space, how to portray that Massachusetts has more electoral votes than Wyoming, or that countries closer to the equator are larger than we think. But for hundreds of years, we’ve been tethered to the idea of looking at the world through the shape of its land. Now that there’s virtually none of that left to explore and discover, it may be time to start thinking about our world in new visual ways: not according to physical space, but to how people are distributed across it, and what their presence can tell us about global poverty, health inequality, environmental impacts, and geopolitics.
Curious and Wondrous Travel Destinations. Migrations Map: Where are migrants coming from? Where have migrants left? 昼夜問わずたくさんの人が行き交い、様々なカルチャーが混じり合う渋谷は、とりわけ若者やビジネスマンから厚く支持されている人気のキャバクラエリアです。

そうした背景から、高級店というよりは比較的リーズナブルな料金で、気軽に利用できるお店がいくつもあるのが特徴。 周辺には多くの店舗が立ち並び、そういった夜のお店の情報量もとても豊富。 単純にお店を探すだけであれば、のようなウェブサイトで調べれば簡単に見つけることができますが、当サイトでは、お店だけではなく働くキャストたちにも注目。 ここ渋谷で働くキャストたちは、元気で明るい話し上手な女性が多く、自然と会話も弾むのでキャバクラ初心者でも楽しむことができます。 渋谷エリア独特の「ノリの良さ」を、ぜひ体験してみませんか。 朝からゆっくりお酒を味わう贅沢ができるお店(XENON/ゼノン) 出典:ナイトバイト JR「渋谷駅」ハチ公口から徒歩3分程。 お店情報. Breathingearth - CO2, birth & death rates by country, simulated real-time. Emergency and Disaster Information Service. Earthquake visualization. EMAG2: Earth Magnetic Anomaly Grid. Worldometers - real time world statistics. U.S. Geological Survey Earthquake Hazards Program.
Earth Dashboard. GPS Visualizer. GeoNames. 40 Maps That Will Help You Make Sense of the World. Maps, charts and infographics can really help bring data and information to life.

Maps can make a point resonate with readers and this collection aims to do just that. Hopefully some of these maps will surprise you and you’ll learn something new. A few are important to know, some interpret and display data in a beautiful or creative way, and a few may even make you chuckle or shake your head. 1. Where Google Street View is Available 2. 3. 4. Pangea was a supercontinent that existed during the late Paleozoic and early Mesozoic eras, forming about 300 million years ago. 5. 6. 7. 8. 9. 10. 11. 12. 13. 14. 15. 16. Submarine Cable Map. World Statistics, Country Comparisons. Worldclock.swf (Objet application/x-shockwave-flash) Free Geography Tools. GeoCommons. GeoHive - Population Statistics.
Exclusive economic Zone.jpg. Flightradar24.com - Live Flight Tracker! Système d'information géographique. Un article de Wikipédia, l'encyclopédie libre.
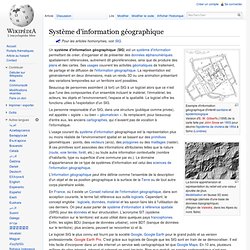
Pour les articles homonymes, voir SIG. La bonne appréhension et représentation du relief est une valeur ajoutée de plus.Modélisation en fausse 3D avec ombrage (dérivée d'une base de données topographique) (Région de Valestra, dans les Alpes du nord, Italie) Your Open Source Compass. Quantum GIS.
SIG la Lettre, le mensuel des Systèmes d'information Géographique, l'actualité de la géomatique, du géomarketing, de la géolocalisation et de la cartographie" Actualités géomatiques (IFE-ENS Lyon) Cette nouvelle rubrique a pour vocation de proposer des billets brefs, présentant l'actualité des ressources géomatiques et de leurs évolutions.

L'ensemble des billets du mois seront repris dans la lettre géomatique correspondante. TweepsMap: outil cartographique pour retrouver ceux qui vous suivent sur Twitter Ville, réalité mixte et mondes virtuels Le participatif dans Google Maps.