

STATegra. Graph Mining. Home page. Data visualization - How to interpret mean of Silhouette plot? Gerstein Lab Lecture Summary.
Pvclust: An R package for hierarchical clustering with p-values. An R package for hierarchical clustering with p-values Ryota Suzuki(a, b) and Hidetoshi Shimodaira(a) a) Department of Mathematical and Computing Sciences Tokyo Institute of Technology b) Ef-prime, Inc.
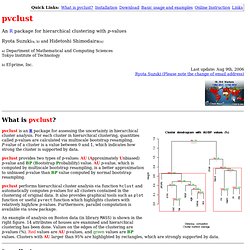
What is pvclust? Pvclust is an R package for assessing the uncertainty in hierarchical cluster analysis. Pvclust provides two types of p-values: AU (Approximately Unbiased) p-value and BP (Bootstrap Probability) value. Pvclust performs hierarchical cluster analysis via function hclust and automatically computes p-values for all clusters contained in the clustering of original data. An example of analysis on Boston data (in library MASS) is shown in the right figure. 14 attributes of houses are examined and hierarchical clustering has been done. Installation pvclust can be easily installed from CRAN. Install.packages("pvclust") On Windows you can use Packages -> Install package(s) from CRAN... from menu bar. Download The latest version should be found at the CRAN web site [FAQ] Q. OBRC: Online Bioinformatics Resources Collection. Informatics Training. In this course, Next Generation Sequencing (NGS), students learn about NGS technologies as well as computational and annotation tools for conducting practical genome-wide analysis and interpretation of NGS data.
Furthermore, the promise of personalized medicine and the applications and implications of NGS in clinical settings will be discussed. Computational Statistics provides a practical introduction to analysis of biological and biomedical data. Basic statistical techniques will be covered, including descriptive statistics, elements of probability, hypothesis testing, nonparametric methods, correlation analysis, and linear regression.
Emphasis is on how to choose appropriate statistical tests and how to assess statistical significance. To visualize data and carry out statistical testing, students learn R, a powerful programming language for statistical computing and graphics. Informatics Training. Module 1: NGS - Technologies and Design OBJECTIVE: Gain basic knowledge of NGS technologies and platforms and develop an understanding of important aspects of NGS studies, including coverage and depth of sequencing, base calling and quality scores, and sources of error.
Learn about NGS applications, including RNA-seq, ChIP-seq, and other functional sequencing assays. Assignment Write a research proposal for a study that utilizes NGS. Assume that you have a budget of 20K for basic biological experiments or 100K for clinical-oriented projects. Start with a description of the problem of interest, including the hypothesis that you would like to test. [~1 page]
NIH LINCS Program. How can Taverna help me? If you need to perform multi-step or repetitive analysis that involves invoking several services, or if you find yourself copying and pasting results between different Web pages or services, and would like to automate this process, then Taverna could be suitable for you.
Taverna allows you to define how your data flows between the services, without having to worry how you are going to invoke these services. It will automate and pipeline processing of your data. Taverna can help you convert data from one format to another in cases when the services you are using are not 100% compatible and shied you from services’ (non-)interoperability horror. Taverna allows for rapid incorporation of new service s without coding. It is not restricted to predetermined services; it provides access to local and remote resources and analysis tools – 3500+ services available on start up.
Taverna will provide you with trackable results of your experiments using the OPM (Open Provenance Model) standard. Seven tips for bio-statistical analysis of gene expression data. Many scientists have a hate-love relationship with statistics.
Personally, I didn’t like statistics (at all) during my masters degree education [1]. Too theoretical, didn’t see the utility of it. Only when I generated my first data during my PhD research, I started realizing the necessity and power of bio-statistics. Later, I almost really fell in love with statistics after reading Intuitive biostatistics by Harvey Motulsky. This excellent book is written by an author who graduated from medical school; this probably explains why it contains only the most pertinent formulas. In September of this year, Nature Methods has initiated a new column 'Points of Significance’ devoted to statistics. Obviously, this blog does not aim to serve as a crash course on statistics. 1. 2.
Paired information means that values in one group are related to the values in the other group. BIOS 560R: High-throughput data analysis using R and bioConductor. Class Information Instructor: Hao Wu.
Email: hao.wu at emory dot edu. TA: TBD. Class/Lab: Monday and Wednesday 3-4:50PM at GCR 115. TA office hour: Drop by, make appointment, or email question Grading: homeworks, class participation and final project. Summary. Bioinformatics and Computational Biology. It Takes 30.