

OPEN TREE OF LIFE. OpenTreeOfLife. Rete Algorithm Demystified! — Part 2 « Everything Decision Management, Technically Speaking. In part 1 of this blog series, I covered the Rete Algorithm and its origin and even the origin of its name.

Now as promised, I am going to explain how it works. It is a challenge to keep it simple not to lose our less technical audience and yet interesting enough for the techies. I hope I will reach that goal. I am trying to convince Carlos to do a Part 3 that will speak to the hard-core techies on more advanced considerations.
And without further due, let me introduce the Rete algorithm! How it works The brilliant idea that Dr. Why is that brilliant you might ask? Rete Algorithm Demystified! — Part 1 « Everything Decision Management, Technically Speaking. To compensate for the “fun break” in my Valentine posting, I decided to tackle a much more technical and deep subject: The RETE Algorithm.
As you probably know if you have read any Rules material, Rete is the dominant algorithm out there. There are actually 2 schools: those that believe in Inference and those who don’t. Rete is the foundational algorithm for executing rules in Inference mode. I discussed in an earlier post the difference and importance of the various algorithms used in commercial BRMS. Practical Statistical Relational Learning. The Assimilation Monitoring Project: The Assimilation Monitoring Project - Incredibly scalable, Incredibly easy to configure, easy on your network. Welcome to the Assimilation project. (README) We provide open source discovery with zero network footprint integrated with highly-scalable monitoring. Here are the problems we address: Organizations are vulnerable to attack through forgotten or unknown systems (30% of all intrusions)Organizations have no automatic infrastructure discovery, or they run it infrequently=> System configuration information is out of date, or only in people's headsSystem discovery is not integrated with monitoringMost organizations have no way of knowing they're monitoring everything - and probably aren'tMost monitoring is time-consuming to configure, incomplete, out-of-date, easily confusedMonitoring is complex and expensive to scale.
Key Players. In the late 90s Michael Jordan, Scottie Pippen, and Dennis Rodman of the Chicago Bulls dominated the basketball court.

They were the key players of the Chicago Bulls, and dominated the NBA offensively and defensively. When exploring a social network you’ll want to find who the key players are for a variety of reasons: New Method to Measure Influence & Susceptibility in Social Networks. In a new paper, published today in Science, Sinan Aral, NYU Stern Assistant Professor of Information, Operations and Management Sciences, and his co-author Dylan Walker, a research scientist at Stern, present a new method to measure influence and susceptibility in social networks.
Today, finding influentials is all the rage. Companies such as Klout are trying to measure “influence scores” for people in social media networks like Facebook and Twitter, and brands are using this information to target them with advertising. Beyond marketers, parents are interested in whether their children’s peers influence education outcomes; managers are interested in whether workers’ colleagues influence their productivity; and policymakers are interested in whether happiness, obesity and smoking are contagious, and if risky behaviors, such as drug abuse, spread as a result of peer-to-peer influence. To read the full paper, visit the Science website. New Talks: “Neo4j in a .NET World (Graph DBs)” and “You’re in production. Now what?” « Tatham Oddie.
Last week I was lucky enough to join an array of great speakers at the NDC Oslo conference.
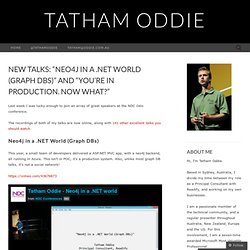
The recordings of both of my talks are now online, along with 141 other excellent talks you should watch. Neo4j in a .NET World (Graph DBs) This year, a small team of developers delivered a ASP.NET MVC app, with a neo4j backend, all running in Azure. This isn’t in POC; it’s a production system. Also, unlike most graph DB talks, it’s not a social network! You’re in production. A tiny subset of your users can’t login: they get no error message yet have both cookies and JavaScript enabled. Marketing have requested that the new site section your team has built goes live at the same time as a radio campaign kicks off.
Social Network Analysis. Miso project: how it will help you make your own Guardian-style infographics and data visualisations. The Miso project and Cabinet Office spending Here on the Guardian's data team, we've wanted to help you visualise our data and create new viz styles for a long time.
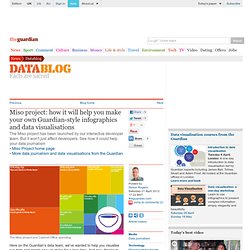
And now, thanks to some great work by the Guardian's Interactive team, that dream has moved one step closer. This week, developers Alastair Dant and Alex Graul launched the first part of the Miso project. In this piece, Alex explains it is a Set of Open Source tools designed to make it faster and easier to create high quality interactive and data visualization content You can see more about the project here on its home page - which also has some examples of visualisations created using the code. Life as Captured in Charts and Graphs. Social Network Analysis.