
Sci-Hub: removing barriers in the way of science. IPython Books - IPython Cookbook. IPython Interactive Computing and Visualization Cookbook This advanced-level book covers a wide range of methods for data science with Python: Interactive computing in the IPython notebook High-performance computing with Python Statistics, machine learning, data mining Signal processing and mathematical modeling Highlights 500+ pages100+ recipes15 chaptersEach recipe illustrates one method on one real-world exampleCode for Python 3 (but works fine on Python 2.7)All of the code freely available on GitHubContribute with issues and pull requests on GitHub.
Academic Phrasebank – Referring to Sources. One of the distinguishing features of academic writing is that it is informed by what is already known, what work has been done before, and/or what ideas and models have already been developed.
Thus, in academic texts, writers frequently make reference to other studies and to the work of other authors. It is important that writers guide their readers through this literature. This section of Academic Phrasebank lists some of the phrases that writers may use for this purpose.A note on the literature review: It is the purpose of the literature review section of a paper or dissertation to show the reader, in a systematic way, what is already known about the research topic as a whole, and to outline the key ideas and theories that help us to understand this. As well as being systematic, the review should be evaluative and critical of the studies or ideas which are relevant to the current work. Research into X has a long history. 50+ Data Science and Machine Learning Cheat Sheets.
Gear up to speed and have Data Science & Data Mining concepts and commands handy with these cheatsheets covering R, Python, Django, MySQL, SQL, Hadoop, Apache Spark and Machine learning algorithms.
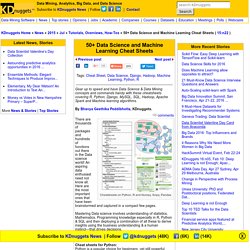
Cheatsheets on Python, R and Numpy, Scipy, Pandas There are thousands of packages and hundreds of functions out there in the Data science world! An aspiring data enthusiast need not know all. Here are the most important ones that have been brainstormed and captured in a compact few pages. Mastering Data science involves understanding of statistics, Mathematics, Programming knowledge especially in R, Python & SQL and then deploying a combination of all these to derive insights using the business understanding & a human instinct—that drives decisions.
Online Statistics Education: A Free Resource for Introductory Statistics. Developed by Rice University (Lead Developer), University of Houston Clear Lake, and Tufts University OnlineStatBook Project Home This work is in the public domain.
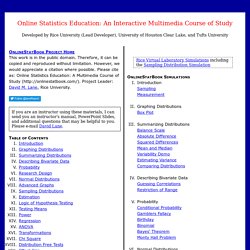
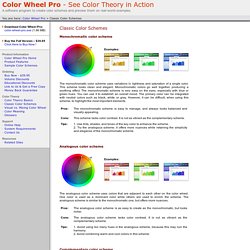
Therefore, it can be copied and reproduced without limitation. However, we would appreciate a citation where possible. Please cite as: Online Statistics Education: A Multimedia Course of Study ( Project Leader: David M. Change your data with one example. Color Wheel Pro: Classic Color Schemes. Monochromatic color scheme.
Beautiful, Free Math. Electronic library. Download books free. Finding books. The best 10 free programs for mathematics (Part III) 조대협의 블로그. 통계학의 기본 아래글은 한국 통계진흥원 손안의 통계 中 "1장 통계 개념 체크하기"를 요약 정리한 내용입니다.
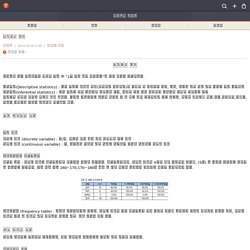
기술통계(Descriptive statistics) : 기술 통계는 수집된 자료(전체이건 표본이건)의 특성을 잘 나타내어 표나, 그림, 평균과 같은 측도 값을 구하는 통계 기법이며 추측통계(Inferential statistics) : 추측 통계는 전체 모집단을 분석하지 않고, 표본을 추출 하여 표본으로 모집단의 특성을 추정하는 방법 통계학의 처음에 정치를 위해서 개발 되었다. 국가를 경영하려면 판단의 지표가 될 수 있는 각종 요약자료가 필요 했는데, 이것이 발전해서 의학,약학,여론조사,경제학,사회학,교육학등 다양한 분야에서 사용되고 있다. 통계 변수 이산형 변수 (discrete variable) : 남/녀, 자동차 종류 등과 같이 연속성이 없는 변수 연속형 변수 (continuous variable) : 키, 몸무게등 실수와 같이 쪼게면 쪼겔수록 무한히 쪼게지는 연속된 변수 도수분포표와 히스토그램 히스토 그램 : 연속형 변수는 히스토그램을 이용하여 표현이 가능하다. 도수분포표 (frequency table) : 빈도수 분포표라고도 하는데, 연속형 변수의 경우 히스토그램 처럼 구간을 나눠서 그래프가 아니라 테이블로 표현한 거나, 이산형 변수의 경우 각 변수의 값을 테이블로 표현한 것을 도수 분포표 라고 한다. 연속형 데이터는 통계량을 요약하는데, 주로 데이터를 표현하는데 다음과 같은 값들을 사용한다. 중심위치의 측도 데이터의 중심 위치를 표현하는 값으로, 평균뿐 아니라 다양한 척도를 사용할 수 있다. * 평균 : 전체 데이터의 합을 개수로 나눈 값. D3.js 라이브러리 소개. 그래프를 보려면 파이어폭스 또는 크롬 브라우저를 이용합니다.
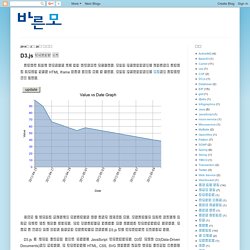
인터넷 익스플로러에서는 블로그에서 그래프가 보이도록 사용한 HTML iframe 태그와 문제가 있는 듯 합니다. 인터넷 익스플로러에서는 이곳에서 그래프를 직접 봅니다. 요즈음 빅 데이터가 유행하면서 인포그래픽에 대한 관심이 많아지고 있다. 인포그래픽이 정보를 시각화해 정보의 이해를 쉽게 해주기 때문이다. 이런 인포그래픽을 표현하기 위한 도구들과 라이브러리들은 다양하다. D3.js 는 데이터 기반으로 문서를 처리하는 JavaScript 라이브러리이다. HTML로 간단한 페이지를 만들거나, 구글링을 하면서 CSS로 웹 페이지에 효과를 넣어보거나, JavaScript 책을 보면서 JavaScript를 작성하거나 소스를 분석하는 정도의 기술을 가진 필자도 D3.js 기술을 분석하여 그래프를 그리는 데 크게 어렵지는 않았다.
D3.js 라이브러리를 처음 알게 된 계기는 필자의 전문 분야인 Apache Camel, Apache ActiveMQ, Apache ServiceMix와 같은 기업 통합 제품들을 위한 새로운 웹 관리자 프로젝트인 hawt.io 프로젝트를 통해서이다. D3.js 홈페이지에 가면 수많은 인포그래픽 데모들과 소스들을 볼 수 있다. 이미 D3.js 기반으로 좀더 추상화한 많은 상위 라이브러리들이 존재한다. 엑셀, 중복값을 처리하는 7가지 방법. 이 내용은 몇 달 전 N사 모 블로그에 직접 포스팅 했던 내용입니다.
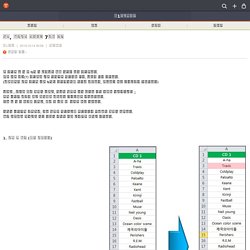
정이 많이 가는(?) 내용이라 굳이 스크랩을 사용하지 않고, 그대로 옮겨 봤습니다. (개인적으로 같은 내용의 글이 N사와 티스토리에서 어떻게 검색되고, 조회되는 지도 비교해보고 싶었습니다) 그런데...분명히 제가 작성한 글인데, 최근에 엑셀을 멀리 했더니 무슨 말인지 모르겠더군요 ;; 저의 기억력 감퇴로 인해 일시적인 게슈탈트 붕괴현상을 경험했습니다. 아마 몇 달 더 지나서 봤으면, 제가 쓴 글인 줄 몰랐을 지도 모릅니다. 1. 한개의 셀에서 중복되는 값만 강조하여 체크하는 방법입니다. 적용하고자 하는 셀을 선택 하신 후, 아래와 같이 셀 강조 규칙만 설정하면 됩니다. 2. 한개의 셀에서 중복되는 값을 다른 셀에 표시하는 방법입니다.
이와 같이 하기 위해서는 B2에 오른쪽에 쓰인 함수를 사용 하면 됩니다. 데이터시각화 언어 D3.js 넌 대체 누구냐?!! D3.js 데이터 분석과 시각화가 주목을 받으면서 관련된 언어선택의 이슈에 맞닿게 됩니다.
자신에게 맞는 언어를 찾아 숙련도를 높여야 하는거죠. 그러기 위해서는 각 언어에 대해 알아야 합니다.