
공간정보 오픈플랫폼 데이터 센터. K-ICT 빅데이터 센터. 주소→좌표 변환서비스. 주소 줄게. 위경도 다오. "왜 군사분계선이 38선이라고 하는 줄 알아?
"라고 누군가 물어본다면 순간 뜨끔할 수도 있다 아니다. 분명 뜨끔해할 것이다! 그 38선이 정말 왜 38선인 줄 모를 수도 있고, 38선이 위도인지 경도인지 헷갈릴 수도 있기 때문이다 예전에는 위도와 경도는 볼 때마다 헷갈렸다... 출처 : Dick Eastman Blog 사실 사는데 위도와 경도가 그렇게 필요한 개념은 아니다. 위도와 경도 ADDRESS 칼럼은 주소만 담겨 있다 예를 들어보자. R을 활용한 변환 데이터저널리즘은 기본적으로 수집, 정제, 분석, 시각화의 프로세스를 거치기 때문에 각 과정과 관련된 패키지 중심으로 R을 활용하고 있다. > ##install.packages("ggmap")> library(ggmap)> data <- read.csv("places.csv", header = TRUE, fileEncoding = "utf-8") ## csv loading> data$address <- enc2utf8(data$address) ##윈도우는 인코딩 한번 처리해줘야 함> data$address <- as.character(data$address) ## make character data$address> data_lonlat <- mutate_geocode(data, address, source='google') ##위경도 변환> write.csv(data_lonlat, "cleaning_data.csv", row.names = TRUE) ##csv export 위의 코드는 재활용할 수도 있는데 본인의 데이터와 칼럼명만 바꿔주면 된다.
좌측 하단 주황색 텍스트는 지금 열심히 Google Map API로 주소를 보내고 위경도 데이터를 받고 있다 것이 좋지 않을까? Google Spreadsheet 사실 R이 익숙지 않다면 위의 코드를 가져가도 어렵다. 역시 Google Spreadsheet는 그 기대를 실망시키지 않는다. 튜터리얼은 아주 쉽다. 1. 2. 3. 4. 5. 6. 유용하게 활용하시길 바래요. Dropbox. 'GIS/RS/IT/Open Source GIS' 카테고리의 글 목록. GIS Developer, 공간정보시스템 개발 블로그 - About. LinkedGeoData is an effort to add a spatial dimension to the Web of Data / Semantic Web.
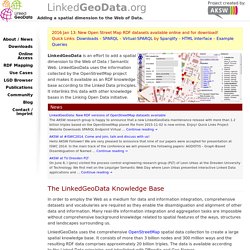
LinkedGeoData uses the information collected by the OpenStreetMap project and makes it available as an RDF knowledge base according to the Linked Data principles. It interlinks this data with other knowledge bases in the Linking Open Data initiative. The LinkedGeoData Knowledge Base In order to employ the Web as a medium for data and information integration, comprehensive datasets and vocabularies are required as they enable the disambiguation and alignment of other data and information. Many real-life information integration and aggregation tasks are impossible without comprehensive background knowledge related to spatial features of the ways, structures and landscapes surrounding us.
공간정보 오픈플랫폼 지도서비스. 메인페이지 > 국가공간정보포털. Mapping UK crime data HowTo. We will create a database and populate it with UK streets and incidents of street crime.
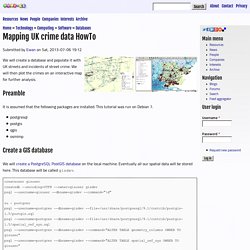
We will then plot the crimes on an interactive map for further analysis. Preamble It is assumed that the following packages are installed. This tutorial was run on Debian 7. UsersWikiMain – PostGIS. Everybody is welcome to contribute to this wiki.
You must login to create new pages and modify existing ones. You can create your own OSGEO Userid or use your existing one or you can use the generic one (login:wiki;password:wiki). Please prefix every new page names in this section with "UsersWiki" in order to easily distinguish them from other Wiki Trac pages. QGIS 예제와 팁 — QGIS Tutorials and Tips. Open Source GeoSpatial) 한국어 지부 - OSGeo Korean Chapter. 주의 사항 : 이 방법을 실행하기 전에 꼭 원본 파일을 백업하시기 바랍니다.
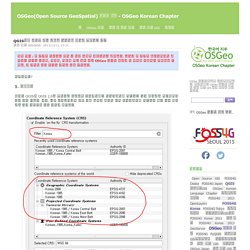
그리고 이 방법을 수행함으로써 발생하는 어떠한 기술적, 재산적, 사업적 손해 등에 대해 OSGeo 한국어 지부나 원 저자인 신상희는 책임지지 않으며, 본 방식에 대한 어떠한 보증도 하지 않습니다. 안녕하세요? 1. 문제점들 새로운 QGIS인 QGIS 2.0를 설치하면 대부분의 컴퓨터에서는 우리나라에서 사용하는 모든 좌표계를 자동적으로 물고 들어 옵니다. QGIS CRS(Coordinate Reference System) 정보창의 Filter에 'Korea'로 입력을 해서 그 결과가 위와 같이 6개만 나올 경우는 정상적으로 한국의 좌표계가 등록되지 않은 경우입니다. 하지만, 이 경우에도 옛날 Bessel1841과 WGS84 사이의 타원체 변환 계수가 등록된 EPSG 정보에서 빠져 있어 정확한 타원체 변환이 이뤄지지 못하는 단점이 있습니다. 이에 따라 QGIS에서 과거 Bessel1841을 준거 타원체로 사용한 지도를 타원체 변환을 하여 저장하거나 혹은 'On-the-fly' 좌표 변환을 통해 현행 GRS80 준거 타원체의 지도와 함께 섞어 쓰면 약 300m 가량의 오차를 보이게 됩니다. 위 그림은 EPSG:5174로 생산된 서울시의 행정동 경계와 EPSG:5181로 제작된 포털 다음맵을 TMS-for-Korea 플러그인을 이용하여 중첩한 화면입니다. 2. 이처럼 타원체 변환 계수를 포함하지 않는 좌표계에 좌표계 변환 계수를 설정시켜 활용하는 방법은 크게 두 가지가 있습니다. 2.1 Custom CRS를 이용하는 법 QGIS에서는 사용자 정의 CRS를 만드는 방법을 제공합니다. Quantum GIS (QGIS) 최신버전 확인하고 프로그램 설치하기. QGIS에서 조난사고 위치도 작성을 위한 속성 변경하기. 공간정보 오픈플랫폼 개발자 센터. 로그인 회원가입 전체메뉴 로그인 선택.
South Korea. Teampopong/codebooks. Southkorea/southkorea-maps. Open Source GeoSpatial) 한국어 지부 - OSGeo Korean Chapter. On Spatial: [QGIS] Create Ring Maps using PyQGIS Script. 공간정보 거점대학 오픈 소스 GIS 고급 과정 교재 작성 중 PyQGIS 샘플 스크립트를 작성하면서 좋은 예제가 없을까 살펴보다 Looking at Temporal Changes 블로그를 보게 되었습니다.
![On Spatial: [QGIS] Create Ring Maps using PyQGIS Script](http://cdn.pearltrees.com/s/pic/th/spatial-create-pyqgis-script-99670347)
기존 샘플의 단계를 좀 더 줄이고, 하나의 폼에 여러 옵션을 생각해 봤습니다. Python 및 PyQGIS를 배우고 있으며, 오류가 있을 수 있으므로 잘못된 코드가 있으면 알려 주시기 바랍니다. QGIS 기반 공간통계. 공간정보거점대학 - PyQGIS 및 플러그인 개발. (1) Visualization: Geochart - Google Charts. Overview A geochart is a map of a country, a continent, or a region with areas identified in one of three ways: The region mode colors whole regions, such as countries, provinces, or states.
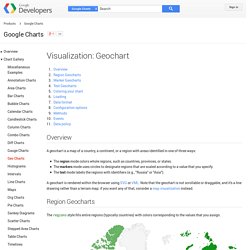
The markers mode uses circles to designate regions that are scaled according to a value that you specify. The text mode labels the regions with identifiers (e.g., "Russia" or "Asia"). A geochart is rendered within the browser using SVG or VML. Region Geocharts The regions style fills entire regions (typically countries) with colors corresponding to the values that you assign. function drawRegionsMap() { var data = google.visualization.arrayToDataTable([ ['Country', 'Popularity'], ['Germany', 200], ['United States', 300], ['Brazil', 400], ['Canada', 500], ['France', 600], ['RU', 700] ]); var options = {}; var chart = new google.visualization.GeoChart(document.getElementById('regions_div')); Marker Geocharts Displaying Proportional Markers Text Geocharts Coloring your chart Loading.
Geographical Targeting - AdWords API. Use the table below to find all available geographical targets.
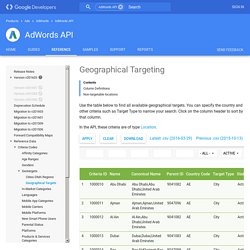
You can specify the country and other criteria such as Target Type to narrow your search. Click on the column header to sort by that column. R의 "googleVis"를 이용하여 대한민국.. : 네이버블로그. Free GIS Data. Digital Elevation Data - with SRTM voids filled using accurate topographic mapping. The downloadable 3 arc second 1x1 Digital Elevation Models on this site are mainly based on data collected by the 2000 Shuttle Radar Topography Mission.
SRTM data, in HGT format, can be downloaded from here, but for some mountain and desert areas there are no-data (void) and phase unwrapping error areas, and there are no SRTM data north of 6020'N. For the tiles here, these areas have been filled and corrected from the best available alternative sources, using the method described on my voidfill page. They are much more accurate than those created by interpolation, with or without the aid of SRTM30. Dongikjang/kssletter · GitHub. GIS 분석 전문 사이트 - 비즈GIS. 자료실 - 좌표계 관련 설명.
좌표계 관련해서 정리가 잘된 자료들, 네이버 백과사전 등등 참고하여 정리해 봤습니다. (참고한 자료를 그대로 인용한 경우도 많습니다.) 최근 좌표계에 흥미가 생겨 공부하는 샘 치고 정리한 자료여서 잘못된 부분이 많을 수 있습니다. Open Source GeoSpatial) 한국어 지부 - OSGeo Korean Chapter. QGIS 공식 Training Manual 한국어판.