

DeathPenaltyFactsMay2012. List of countries by military expenditures. This article is a list of countries by military expenditure, the amount spent by a nation on its military in a given year.
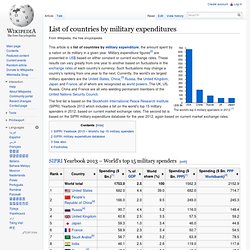
Military expenditure figures[2] are presented in US$ based on either constant or current exchange rates. These results can vary greatly from one year to another based on fluctuations in the exchange rates of each country's currency. Such fluctuations may change a country's ranking from one year to the next. Currently, the world's six largest military spenders are the United States, China,[3] Russia, the United Kingdom, Japan and France, all of whom are recognized as world powers. The UK, US, Russia, China and France are all veto-wielding permanent members of the United Nations Security Council. The first list is based on the Stockholm International Peace Research Institute (SIPRI) Yearbook 2013 which includes a list on the world's top 15 military spenders in 2012, based on current market exchange rates. SIPRI Yearbook 2013 – World's top 15 military spenders[edit] World-resources-map-r2.gif (GIF Image, 1450x1450 pixels) - Scaled (44%)
Democracy Index. The Economist Intelligence Unit Democracy index map for 2012.
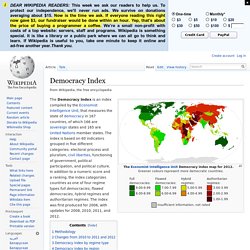
Greener colours represent more democratic countries. Insufficient information, not rated The Democracy Index is an index compiled by the Economist Intelligence Unit, that measures the state of democracy in 167 countries, of which 166 are sovereign states and 165 are United Nations member states. The index is based on 60 indicators grouped in five different categories: electoral process and pluralism, civil liberties, functioning of government, political participation, and political culture.
In addition to a numeric score and a ranking, the index categorizes countries as one of four regime types full democracies, flawed democracies, hybrid regimes and authoritarian regimes. Methodology[edit] As described in the report,[1] the democracy index is a weighted average based on the answers of 60 questions, each one with either two or three permitted alternative answers. Changes from 2010 to 2011 and 2012[edit] See also[edit]
Corruption Perceptions Index: Transparency International. Public outcry at corruption, impunity and economic instability sent shockwaves around the world in 2011.
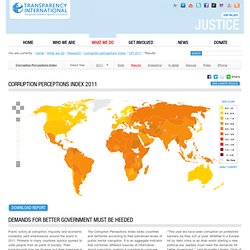
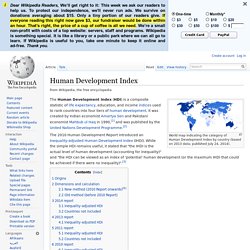
Protests in many countries quickly spread to unite people from all parts of society. Their backgrounds may be diverse, but their message is the same: more transparency and accountability is needed from our leaders. The 2011 Corruption Perceptions Index shows that public frustration is well founded. No region or country in the world is immune to the damages of corruption, the vast majority of the 183 countries and territories assessed score below five on a scale of 0 (highly corrupt) to 10 (very clean.) New Zealand, Denmark and Finland top the list, while North Korea and Somalia are at the bottom. Human Development Index. World map indicating the category of Human Development Index by country (based on 2013 data; published July 24, 2014).
The 2010 Human Development Report introduced an Inequality-adjusted Human Development Index (IHDI). While the simple HDI remains useful, it stated that "the IHDI is the actual level of human development (accounting for inequality)" and "the HDI can be viewed as an index of 'potential' human development (or the maximum IHDI that could be achieved if there were no inequality)".[3] Origins[edit] Dimensions and calculation[edit] New method (2010 Report onwards)[6][edit] Published on 4 November 2010 (and updated on 10 June 2011), starting with the 2010 Human Development Report the HDI combines three dimensions: A long and healthy life: Life expectancy at birthEducation index: Mean years of schooling and Expected years of schoolingA decent standard of living: GNI per capita (PPP US$) In its 2010 Human Development Report, the UNDP began using a new method of calculating the HDI. 1.
List of countries by GDP (nominal) This article includes a list of countries in the world sorted by their gross domestic product (GDP), the market value of all final goods and services from a nation in a given year.
The GDP dollar estimates presented here are calculated at market or government official exchange rates. Several economies which are not considered to be countries (world, the EU, and some dependent territories) are included in the lists because they appear in the sources. These economies are not ranked in the charts here, but are listed where applicable. List of countries by GDP (nominal) per capita.
Countries by 2013 GDP (nominal) per capita.[1] This is a list of countries sorted by their gross domestic product per capita at nominal values.
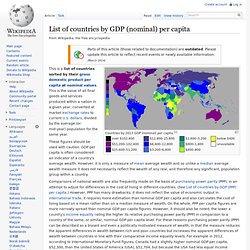
This is the value of all final goods and services produced within a nation in a given year, converted at market exchange rates to current U.S. dollars, divided by the average (or mid-year) population for the same year. These figures should be used with caution. GDP per capita is often considered an indicator of a country's average wealth. However, it is only a measure of mean average wealth and so unlike a median average wealth measure it does not necessarily reflect the wealth of any real, and therefore any significant, population group within a country.