
How To Outperform The Market. Performance and the Short Term Traders are "active" because for them the importance of the market's short-term activity is magnified - these market movements offer opportunity for accelerated capital gains.

Day Trading Strategies For Beginners. Day trading is the act of buying and selling a financial instrument within the same day or even multiple times over the course of a day.

Taking advantage of small price moves can be a lucrative game — if it is played correctly. But it can be a dangerous game for newbies or anyone who doesn't adhere to a well-thought-out strategy. What's more, not all brokers are suited for the high volume of trades made by day traders. But many popular online brokers, such as E*TRADE, TD Ameritrade, and Interactive Brokers, have professional or advanced versions of their platforms that feature real-time streaming quotes, advanced charting tools, and the ability to enter and modify complex orders in quick succession. Let's take a look at some general day trading principles and then move on to deciding when to buy and sell, common day trading strategies, basic charts and patterns, and how to limit losses. 10 Basic Day Trading Tips 1. 2. Assess how much capital you're willing to risk on each trade. 3. 3 Things Investors Can Learn From Traders. The first rule of investing is buy low and sell high.

After all, that's the only way you can actually make any money in the market. Nearly all investors would agree with that idea. But there's another group of market participants that are trying to do the exact same thing - they're just trying to do it in a different time frame and with a different methodology. They're called traders. Generally speaking, investors tend to scoff at traders. SEE: An Introduction To Day Trading.
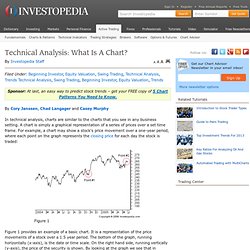
Peak-and-Trough Analysis. Peaks and troughs are patterns that are developed by the price action experienced by all securities.
As we know, prices never move in straight lines, whether in an uptrend or a downtrend. The term "zigzag pattern" has been used to describe the peaks and troughs, and many charting software programs will have a '%-zigzag' indicator that investors can lay down on a chart that they are viewing. The Ups and DownsRising peaks and troughs can be seen easily on a chart by recognizing the higher peaks, or tops, and higher troughs, or bottoms, creating the uptrend.
Another way to look at it would be to recognize that each new top that is created by the price action is higher than the high of the previous few days, weeks or even months of trading. As well, each new trough would also be higher than the previous trough over the same period of time. In the above chart of PepsiCo Inc.
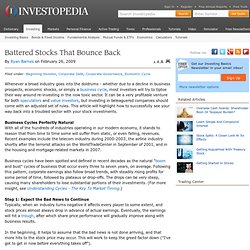
Technical Analysis: What Is A Chart? By Cory Janssen, Chad Langager and Casey Murphy In technical analysis, charts are similar to the charts that you see in any business setting.
A chart is simply a graphical representation of a series of prices over a set time frame. For example, a chart may show a stock's price movement over a one-year period, where each point on the graph represents the closing price for each day the stock is traded: Figure 1 provides an example of a basic chart. Battered Stocks That Bounce Back. Whenever a broad industry goes into the doldrums - whether due to a decline in business prospects, economic shocks, or simply a business cycle, most investors will try to tiptoe their way around re-investing in the now toxic sector.
It can be a very profitable venture for both speculators and value investors, but investing in beleaguered companies should come with an adjusted set of rules. This article will highlight how to successfully see your way back into a troubled sector with your stock investments. Business Cycles Perfectly NaturalWith all of the hundreds of industries operating in our modern economy, it stands to reason that from time to time some will suffer from static, or even falling, revenues. Recent examples include the telecom industry during 2000-2003, the airline industry shortly after the terrorist attacks on the WorldTradeCenter in September of 2001, and in the housing and mortgage-related markets in 2007.
Find out exactly what is on the balance sheet. Recession: What Does It Mean To Investors? To further complicate matters, not all business cycles go through these four steps sequentially.

For instance, during a double dip recession, the economy goes through a recession followed by a short recovery and another recession without ever peaking. (Not everyone hurts during a recession. Learn more in Industries That Thrive On Recession.) Recession Versus ExpansionRecession is loosely defined as two consecutive quarters of decline in GDP output. This definition can lead to situations where there are frequent switches between a recession and expansion and, as such, many different variations of this principle have been used in the hope of creating a universal method for calculation. By looking at these four indicators, economists at the NBER hope to gauge the overall health of the market and decide whether the economy is in recession or expansion. What Does this Mean for Investors? First, remember that a bear market does not mean there are no ways to make money. Divergences, Momentum And Rate Of Change. Momentum is positive if today's price is higher than the price of X days ago, negative if today's price is lower, and at zero if today's price is the same.
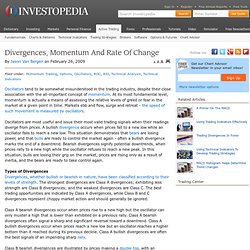
Using the momentum figure that he or she calculates, the trader will then plot a slope for the line connecting calculated momentum values for each day, thereby illustrating in linear fashion whether momentum is rising or falling. Similarly, the rate of change divides the latest price by a closing price X days hence. Gauging Support And Resistance With Price By Volume. Many say that charting is nothing more than predicting the direction of a price between significant support and resistance levels.
We know that a support level is a price level which a stock has had difficulty falling below. This is where a lot of buyers tend to enter the stock. How To Use Volume To Improve Your Trading. Retracement Or Reversal: Know The Difference. In most cases, retracements will stay around 38.5% (daily) or 50% (intraday).
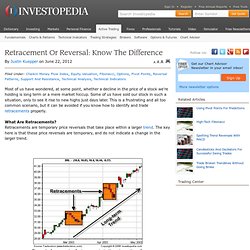
If the price moves below these levels, then a reversal may be forming. SEE: Top 4 Fibonacci Retracement Mistakes To Avoid Pivot PointsPivot point levels are also commonly used when determining the scope of a retracement. Most traders look at the lower supports (R1, R2 and R3) - if these are broken, then a reversal may be forming.