
Des capsules avec une animation de "main qui dessine" - Padagogie. Ce sont des logiciels accessibles via Internet, et donc en soi facile d’accès.
20 Cool Tools for Creating Infographics. Imagine you are an infographic maker god who can take 1,000 words and help people digest that information in only a few seconds.
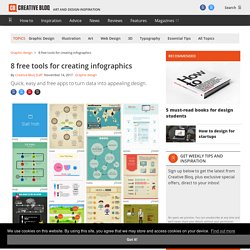
An infographic, put simply, is a creative way to take a “thousand words” and depict them using a picture. These days, readers are looking for quick access to brief information. Website visitors love this unique form of presentation which is quickly gaining popularity, and in some cases, becoming the standard form of communication instead of page long, lengthy blog posts. 10 free tools for creating infographics. Done right, infographics can be a great way to make sense of complex data.
The best infographics transform complex information and data into graphics that are both easy to grasp and visually appealing. The only problem is, infographics that look like they were simple to make are often anything but. How To Create Outstanding Modern Infographics. In this tutorial you will learn that data doesn't have to be boring, it can be beautiful!

Learn how to use various graph tools, illustration techniques and typography to make an accurate and inspiring infographic in Adobe Illustrator. Start by using the Rectangle Tool (M) to draw a shape. Give it a subtle radial gradient too. The entire design is based on a grid of four columns. To make the columns first select the rectangle and drag a guide onto the centre of the shape.
Condense the shape so it fits within the left-most guide and centre guide. Move the shape over to the right and add another guide to the centre here. Using the Rectangle Tool (M) draw a thin white box on the centre line that will be the width of the gap between the columns. Wideo. Studio de création de vidéos d’animation pour tous – Les Outils Tice. Wideo est un outil en ligne qui fournit un véritable studio professionnel pour créer facilement des vidéos d’animation.
Wideo peut être ainsi utilisé comme un formidable outil pour réaliser des présentations animées créatives. Il peut être utilisé aussi bien par les enseignants que par les apprenants pour réaliser des petits clips vidéos qui devraient favoriser l’attention des élèves. 10 sites pour créer une infographie. Les infographies permettent de visualiser plus facilement un ensemble de données parfois complexe. Une image est parfois plus parlante qu’un long discours ! Elles permettent de comprendre en un coup d’œil les principaux enseignements d’une étude quantitative par exemple. Create and share visual ideas online. 5 Great Online Tools for Creating Infographics. Professional infographic designers rely primarily on a core vector graphics software program to create their infographics designs.
The main advantage is that all the icons, charts, images, illustrations, and data visualizations are treated as separate objects that can be easily moved, resized, overlapped, and rotated. 10 Great Examples of Using Infographics for Education. Infographics are a great and creative way to get your message across, anything from school lessons, through homework and essays, to data for your college research.
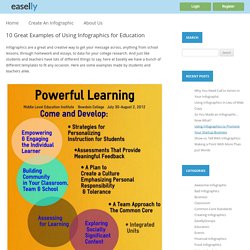
And just like students and teachers have lots of different things to say, here at Easelly we have a bunch of different templates to fit any occasion. Here are some examples made by students and teachers alike. This is a great choice for a background. The warm color gives off a friendly feeling and having it as a gradient makes sure it isn’t just a dull field of pixels.
It lays out its key points simply and also makes the text stand out nicely, with the black on the lighter side and a contrasting blue on the other. Accenting relations between segments by changing the shade of the basic color was a nice idea here. This one is very clean and just lively enough. This here piece is really appealing. Free Infographic Maker. The 18 Best Free Web Tools Chosen By You. It’s the start of a new year and that means there’s infinite possibilities that lay before you. But you can’t move forward without arming yourself with the best free web tools and apps. How to make infographics: a beginner’s guide to data visualisation. As a growing number of international NGOs are using infographics, charts and interactive maps to share success and highlight disaster, how can organisations with less resources create high quality visualisations without having to pay to outsource them?
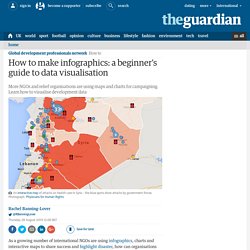
We’ve put together a beginner’s guide for visualising development data. Organising your data The first thing you need to do is have a clear idea of the data you want to visualise. More Links... Information is beautiful: 30 examples of creative infography. 20+ Tools to Create Your Own Infographics. A picture is worth a thousand words – based on this, infographics would carry hundreds of thousands of words, yet if you let a reader choose between a full-length 1000-word article and an infographic that needs a few scroll-downs, they’d probably prefer absorbing information straight from the infographic. What’s not to like? Colored charts and illustrations deliver connections better than tables and figures and as users spend time looking back and forth the full infographic, they stay on the site longer.
Plus, readers who like what they see are more likely to share visual guides more than articles. While not everyone can make infographics from scratch, there are tools available on the Web that will help you create your very own infographics. In this article, we’re listing more than 20 such options to help you get your messages across to your readers, visually. Read Also: The Infographic Revolution: Where Do We Go From Here? What About Me? “What About Me?” Vizualize.me Piktochart easel.ly. L'exception pédagogique.
Informations juridiques Conditions d'utilisation : Droit de propriété intellectuelle : la présentation et le contenu du site www.cndp.fr constituent des oeuvres protégées par la législation française et internationale relative à la propriété intellectuelle.
Les éléments de fond protégeables tels que les textes, les photographies, les données, les graphiques, les vidéos, les images , ainsi que les éléments de forme (choix, plan, disposition des matières, organisation des données ) sont la propriété du CNDP au titre du droit d'auteur et au titre du droit du producteur de la base de données. How to Turn Infographics Into Effective Teaching Tools - ScribbleLive - Your Content Marketing Software. Infographics have already established themselves as engaging news and marketing tools, but they are also entering the education space in new and exciting ways.
Teachers can find infographics useful classroom tools in a number of ways. Most prominently, a good graphic makes information easily accessible, as it feeds into many students’ natural tendency to learn by seeing and interacting. As educators around the country transition to the new Common Core State Standards, infographics can help them meet their learning goals.
For those unfamiliar with the Common Core conversation, the new standards are meant to “provide a consistent, clear understanding of what students are expected to learn,” across the U.S. public education system. Ways to Teach Using Infographics. However, today I am sharing with you a great video by Kathy Shrock on Infographics as creative assessments. Here are some of the important ideas included in the video : Faire une infographie avec canva.com. Free Infographic Maker - Venngage. Create Easy Infographics, Reports, Presentations. Infographics. Free Word Cloud Generator. Word clouds can be extremely useful for gaining insights into virtually any large body of text. They can be used to study such things as corporate reports, political speeches, historical documents, news reports, public opinions, tweets, and so forth.
This particular word cloud generator is designed to be not only flexible and easy-to-use, but also to produce high-quality, visually appealing word cloud images. In the images created by this word cloud generator you will find that the most frequently occurring words within your text appear toward the center of the cloud, while less frequent words appear at the periphery. You will also notice that the size of each word varies in direct proportion to the frequency with which it appears in your text. Tout ce qu'il faut savoir sur les licences Creative Commons. Je m'y réfère tous les jours, que ce soit ici pour ce blog, pour LittleThingz, et pour illustrer tout un tas de choses, et pourtant je me rends compte que je ne suis jamais vraiment entré dans le détail pour expliquer ici ces fameuses licences Creative Commons.
Car oui, sauf exceptions de rares photos personnelles, de captures d'écran, ou de quelques images "piquées" sur les pages d'un service web parce que j'en fait la promotion, toutes les images que tu trouves ici sont distribuées selon une de ces licences. Et pourtant, j'ai l'impression que ce n'est pas la règle sur la majorité des blogs et sites web, et je pense que c'est bien dommage. Voici donc l'essentiel de ce qu'il faut savoir sur le sujet, en t'expliquant un peu ma manière personnelle de gérer ça. Pourquoi faut-il connaître et utiliser ces licences ?