
Ogre - ogr2ogr web client.
GIS. Data. The Sunlight Foundation. DATACOLLIDER - MIT Senseable City Laboratory. Open Data Hackathon 2014: Hack for Piter — Проекты. Найти координаты Google Maps легко. Greenhoney/ Language represents our view of the world, and knowing its limits helps us understand how our perception works.
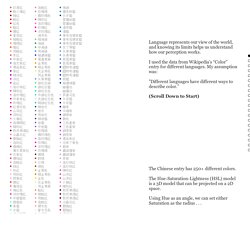
I used the data from Wikipedia’s “Color” entry for different languages. My assumption was: "Different languages have different ways to describe color.” (Scroll Down to Start) Green Honey. Peer 2 Peer University. School of Data - Evidence is Power. LABs. Visualizing Algorithms. The power of the unaided mind is highly overrated… The real powers come from devising external aids that enhance cognitive abilities.
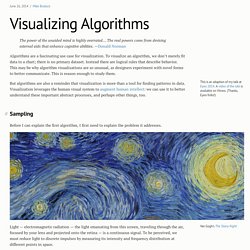
—Donald Norman Algorithms are a fascinating use case for visualization. To visualize an algorithm, we don’t merely fit data to a chart; there is no primary dataset. Instead there are logical rules that describe behavior. DATACOLLIDER - MIT Senseable City Laboratory. Tableau. OpenRefine. Free Data Visualization Software. About Fusion Tables - Fusion Tables Help. Bust your data out of its silo!

Get more from data with Fusion Tables. Fusion Tables is an experimental data visualization web application to gather, visualize, and share data tables. ColorBrewer: Color Advice for Maps. Big Data Science Stuff.