
Decoding Nature’s Soundtrack - Issue 12: Feedback. One of most immediately striking features about Bernie Krause is his glasses.
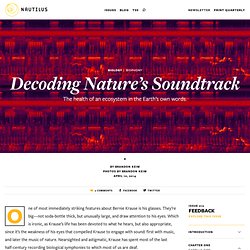
They’re big—not soda-bottle thick, but unusually large, and draw attention to his eyes. Which is ironic, as Krause’s life has been devoted to what he hears, but also appropriate, since it’s the weakness of his eyes that compelled Krause to engage with sound: first with music, and later the music of nature. Nearsighted and astigmatic, Krause has spent most of the last half-century recording biological symphonies to which most of us are deaf. Even more than Krause sees, he listens. It’s an unusual trait. That will likely be what you remember, too. “The voice of the natural world informs us about our place in the living world and how we’re affecting it,” he says.
To Krause, these are measurements best made by listening to natural soundscapes. In each spectrogram, Krause points something out: No matter how sonically dense they become, sounds don’t tend to overlap. First to read the news is a scrub jay. RMIT Architecture - SPATIAL INFORMATION ARCHITECTURE LABORATORY (SIAL) PROJECTS proj » teaching | parametric | ontology | adv env | sound | culture | computation | exhibition | arc SOUND PROJECTS sial sound studio projects, sound installations, acoustic design, sound simulation RMIT ARCHITECTURE/LANDSCAPE/INDUSTRIAL DESIGN STUDIO LIVINGLAB 01 : VERTIGO RMIT Architecture + Industrial Design + Landscape Architecture Upper Pool Design Studio - SIAL stream This studio will bring together students from several design disciplines to explore the imaginative use of ‘vertical’ space.
There will be an emphasis on design development, construction and tectonics, using digital and physical modelling as the media for developing design intentions. We will operate within a broader interdisciplinary community, with this group working with counterparts in structural and environmental engineering and with input from spatial sound. Students will investigate the dual concepts of ‘verticality’ and ‘sustainability’. Chladni Figures and Vibrating Plates. We find experimentally and theoretically that thin plates or membranes resonate at certain "modes.
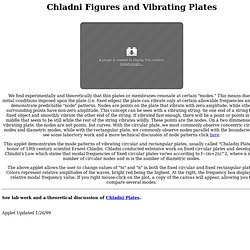
" This means due to initial conditions imposed upon the plate (i.e. fixed edges) the plate can vibrate only at certain allowable frequencies and will demonstrate predictable "node" patterns. Nodes are points on the plate that vibrate with zero amplitude, while other surrounding points have non-zero amplitude. This concept can be seen with a vibrating string: tie one end of a string to a fixed object and smoothly vibrate the other end of the string. If vibrated fast enough, there will be a point or points in the middle that seem to be still while the rest of the string vibrates wildly. These points are the nodes. This applet demonstrates the mode patterns of vibrating circular and rectangular plates, usually called "Chaladni Plates" in honor of 18th century scientist Ernest Chladni.
See lab work and a theoretical discussion of Chladni Plates. Equal loudness contours and audiometry - Test your own hearing. Repeat: do not start in the top third of the chart.
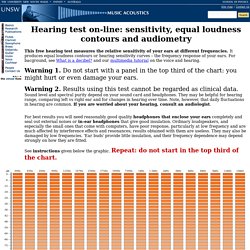
How to use this web service to measure equal loudness curves. Minimise any background noise: turn off machinery, close windows etc. If your computer has a fan, you may be able to put it under the desk. Plug headphones into your soundcard output and put them on, making sure that they seal well around your ears. In the 1 kHz column, choose a panel about halfway down. What does your hearing curve mean? Most people will find that their hearing is most sensitive around 1–4 kHz and that it is less sensitive at high and low frequencies.
How does your hearing response depend on loudness? The shape of your hearing response curve probably depends on loudness. Can you use this web service to measure hearing threshold curves? It is possible, but not likely. If so, the method would be to find the lowest sound level audible at each frequency. What do levels on the measured curve mean? Calibration and improvements. Related pages.