
Tropy. Welcome. Title IX Sexual Assault Investigation Tracker from The Chronicle of Higher Education. Businessinsider. A few decades ago, when you wanted to learn something new it typically meant spending a couple of evenings a week at a local school, taking a photography or bookkeeping class from a bored night school instructor.

Today, the worlds of learning and personal or professional development are literally at your fingertips. The open learning movement has made the opportunity to get smarter in your spare time completely accessible to anyone with an internet connection, and it's exploded in recent years. Pandoc - About pandoc. 3D for Everyone. Free reference manager and PDF organizer. The 10 Commandments of Visual Communication. Visuals are everywhere.

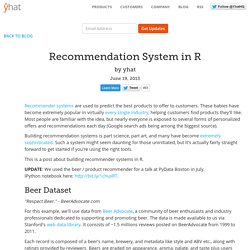
Since the last decade, the art of visual communication has boomed by leaps and bounds and is, to the date, on a marked rise. Today, one cannot imagine the internet without all the GIFs, infographics, and memes floating it. With visual data on the rise and most of us being immensely fond of it, everyone now seems to be creating their own versions of it. 10 free tools for creating infographics. Done right, infographics can be a great way to make sense of complex data.
The best infographics transform complex information and data into graphics that are both easy to grasp and visually appealing. The only problem is, infographics that look like they were simple to make are often anything but. Exclusive offer: Save 15% on Adobe Creative Cloud now Here, we've selected our top free tools and apps for making infographics. Some of the options here are even suitable for non-designers, as templates and other features make them easy to use. Give these free tools a try and let us know which ones you get on best with on Facebook or Twitter. 01. US News map interactive lets you map how historical newspapers digitized by Chronicling America changed over time. The U.S. news map works best on a larger screen.

Click here to email a link to yourself for later viewing. This interactive map, put together by the Georgia Tech Research Institute and the University of Georgia's eHistory initiative, uses the Library of Congress' database of historical newspapers, Chronicling America, to track frequency of keywords in newspapers and visualize the results across time and space. Unfiltered.news. The Internet, peer reviewed. Office Sway - Create and share amazing stories, presentations, and more.
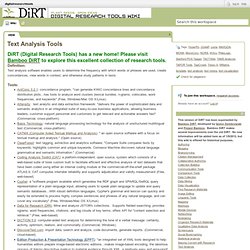
PALLADIO beta. Hemingway. Timeline JS - Beautifully crafted timelines that are easy, and intuitive to use. America's Hangover: Prohibitions Unintended Consequences. Timeline JS - Beautifully crafted timelines that are easy, and intuitive to use. RoSE: Welcome to RoSE! Recommendation System in R. Recommender systems are used to predict the best products to offer to customers.
These babies have become extremely popular in virtually every single industry, helping customers find products they'll like. Most people are familiar with the idea, but nearly everyone is exposed to several forms of personalized offers and recommendations each day (Google search ads being among the biggest source). Building recommendation systems is part science, part art, and many have become extremely sophisticated. Such a system might seem daunting for those uninitiated, but it's actually fairly straight forward to get started if you're using the right tools.
This is a post about building recommender systems in R. UPDATE: We used the beer / product recommender for a talk at PyData Boston in July. Fargo. Storify · Make the web tell a story. D3.js - Data-Driven Documents. Santiago Ortiz website. Welcome // Vega: A Visualization Grammar. Word Tree. Voyant Tools: Reveal Your Texts.
Word Tree. A word tree is a visual search tool for unstructured text, such as a book, article, speech or poem. It lets you pick a word or phrase and shows you all the different contexts in which it appears. The contexts are arranged in a tree-like branching structure to reveal recurrent themes and phrases. The image above is a word tree made from Martin Luther King's famous "I have a dream" speech, using the search term "I. " Font sizes show frequency of use, so you can see that among King's many uses of "I," the most frequent context is the phrase "I have a dream. " Datavisualization.ch Selected Tools. SIMILE Project. Timeglider: web-based timeline software. Text Analysis Tools. Definition: Text analysis software enables users to determine the frequency with which words or phrases are used, create concordances, view words in context, and otherwise study patterns in texts.
Tools: Resources: caqdas Networking Project: "We provide practical support, training and information in the use of a range of software programs designed to assist qualitative data analysis. "KDNuggets: A text analysis software directoryTAPoR Text Analysis Recipes: Straightforward, step-by-step instructions for using text analysis tools to accomplish particular research tasks.WikiTADA: The collaborative website of the Text Analysis Developers Alliance. References: Evaluating the Quality of Electronic Texts, Lisa Spiro, director of the Digital Media Center at Fondren Library, Rice University.
Cataloging History Timeline. Dipity - Find, Create, and Embed Interactive Timelines. Rapid mashup development tool for Google and Yahoo maps! Create beautiful dynamic data driven maps. Fast and beautiful maps.