
Creating a graph — NetworkX 1.7 documentation. Start here to begin working with NetworkX.
Create an empty graph with no nodes and no edges. >>> import networkx as nx>>> G=nx.Graph() By definition, a Graph is a collection of nodes (vertices) along with identified pairs of nodes (called edges, links, etc). In NetworkX, nodes can be any hashable object e.g. a text string, an image, an XML object, another Graph, a customized node object, etc.
(Note: Python’s None object should not be used as a node as it determines whether optional function arguments have been assigned in many functions.) The graph G can be grown in several ways. Add a list of nodes, >>> G.add_nodes_from([2,3]) or add any nbunch of nodes. >>> H=nx.path_graph(10)>>> G.add_nodes_from(H) Note that G now contains the nodes of H as nodes of G. The graph G now contains H as a node. Networks, Crowds, and Markets: A Book by David Easley and Jon Kleinberg. In recent years there has been a growing public fascination with the complex "connectedness" of modern society.
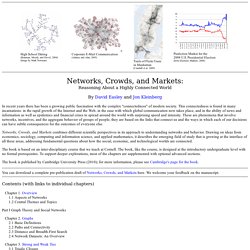
This connectedness is found in many incarnations: in the rapid growth of the Internet and the Web, in the ease with which global communication now takes place, and in the ability of news and information as well as epidemics and financial crises to spread around the world with surprising speed and intensity. These are phenomena that involve networks, incentives, and the aggregate behavior of groups of people; they are based on the links that connect us and the ways in which each of our decisions can have subtle consequences for the outcomes of everyone else.
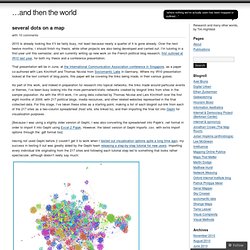
Networks, Crowds, and Markets combines different scientific perspectives in its approach to understanding networks and behavior. The book is based on an inter-disciplinary course that we teach at Cornell. The book, like the course, is designed at the introductory undergraduate level with no formal prerequisites. Several dots on a map « …and then the world.
2010 is already looking like it’ll be fairly busy, not least because nearly a quarter of it is gone already.
Over the next twelve months, I should finish my thesis, while other projects are also being developed and carried out: I’m tutoring in a first-year unit this semester, and am currently writing up new work on the French political blog research, first outlined at IR10 last year, for both my thesis and a conference presentation. That presentation will be in June, at the International Communication Association conference in Singapore, as a paper co-authored with Lars Kirchhoff and Thomas Nicolai from Sociomantic Labs in Germany.
Where my IR10 presentation looked at the text content of blog posts, this paper will be covering the links being made, in their various guises. [Because I was using a slightly older version of Gephi, I was also converting the spreadsheet into Pajek's .net format in order to import it into Gephi using Excel 2 Pajek. Like this: Like Loading... Using Netvizz & Gephi to Analyze a Facebook Network « persuasion. This post was originally featured on published on May 6th, 2010.
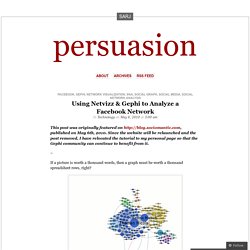
Since the website will be relaunched and the post removed, I have relocated the tutorial to my personal page so that the Gephi community can continue to benefit from it. If a picture is worth a thousand words, then a graph must be worth a thousand spreadsheet rows, right? A Facebook network rendered in Gephi Okay, maybe not, but for practitioners and researchers alike, data visualization can reveal insights that aren’t always obvious from looking at the raw data, no matter how well organized it may be.
When we’re talking about social network, data visualization takes the form of a “social graph,” and it can be a powerful tool to discover deeper meanings and applications behind the relationships and communities within a network. Here you can see some social graphs of the French political blogosphere created by researcher Tim Highfield using an open-source network visualization software called Gephi. Social Network Analysis. Nodus Labs. Introduction aux graphes avec Neo4j et Gephi. Les solutions permettant de modéliser, stocker et parcourir de façon efficiente des graphes ont profité de plusieurs éléments qui les ont rendues populaires ces dernières années.

Le premier élément aidant à leur démocratisation est l’explosion des réseaux sociaux. Un cas d’usage évident, facile à comprendre même si, étrangement, les solutions mises en œuvre ne sont pas forcément de « type graphe » (par exemple avec FlockDB chez Twitter). Le second est lié au mouvement NoSQL qui a aidé à diffuser l’idée que la base relationnelle n’est pas la seule solution de stockage et de requêtage. Enfin, et même si la théorie des graphes n’est pas neuve, les algorithmes sous-jacents et certaines implémentations ont atteint un niveau de maturité permettant la « commoditisation » de ces technologies, les aidant du même coup à sortir de zones très spécifiques.
Alors qu’est-ce qu’un graphe? Un graphe est une structure de données, associant entre eux des nœuds (ou sommets) par des relations. Property graphs. Humanities software, visualization and analysis. Gephi, an open source graph visualization and manipulation software.