
The Opte Project. What D3.js is Not. I have played with D3.js quite a bit recently.

After exploring its API and building a rather complex chart, I come to realize that I have misunderstood D3 for a long time. It’s not only me, after talking to my friends, they also have misconceptions regarding D3. So I’ve decided to write this post to clear some of the common misunderstandings. D3 is Not a Charting Library When you go to D3 homepage, you can see lots of amazing charts and visualizations. Tributary.
Sigma js. Interactive Data Visualization for the Web. Copyright © 2013 Scott Murray Printed in the United States of America.
O’Reilly books may be purchased for educational, business, or sales promotional use. Online editions are also available for most titles ( For more information, contact our corporate/institutional sales department: 800-998-9938 or <corporate@oreilly.com>. Original Content Marketing for Brands. Create and share visual ideas online. The 37 best tools for data visualization. It's often said that data is the new world currency, and the web is the exchange bureau through which it's traded.
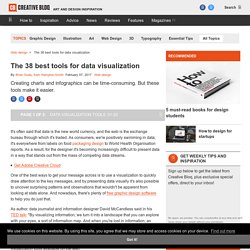
As consumers, we're positively swimming in data; it's everywhere from labels on food packaging design to World Health Organisation reports. As a result, for the designer it's becoming increasingly difficult to present data in a way that stands out from the mass of competing data streams. Get Adobe Creative Cloud One of the best ways to get your message across is to use a visualization to quickly draw attention to the key messages, and by presenting data visually it's also possible to uncover surprising patterns and observations that wouldn't be apparent from looking at stats alone. Large.jpg (JPEG Image, 3000 × 2011 pixels) - Scaled (34%) Jambalaya: an interactive environment for exploring ontologies.
Margaret-Anne Storey, Natalya F.

Noy, M.A. Musen, Casey Best, Ray Fergersen, Neil Ernst, “Jambalaya: an interactive environment for exploring ontologies”, International Conference on Intelligent User Interfaces, 2002 (Link) Abstract:This demonstration presents a visualization environment for exploring ontologies. An ontology defines a common vocabulary and structure of an information space for researchers and domain experts to exchange and share knowledge. A domain expert defines classes to represent concepts in a domain of discourse, with slots representing properties and relationships between the concepts. Freeplane/freeplane. DERI Pipes. Blockd3. News and Community for Visual Thinkers. The Data Visualisation Catalogue. A Periodic Table of Visualization Methods. Datavisualization.ch.
Visualize This: The FlowingData Guide to Design, Visualization, and Statistics. InfoVis:Wiki. The 33 best tools for data visualization. Bdon's Department of Novelty (bdon.org) NAViGaTOR - Network Analysis, Visualization, & Graphing TORonto. NAViGaTOR (Network Analysis, Visualization, & Graphing TORonto) is a software package for visualizing and analyzing protein-protein interaction networks.

NAViGaTOR can query OPHID / I2D - online databases of interaction data - and display networks in 2D or 3D. To improve scalability and performance, NAViGaTOR combines Java with OpenGL to provide a 2D/3D visualization system on multiple hardware platforms. NAViGaTOR also provides analytical capabilities and supports standard import and export formats such as GO and the Proteomics Standards Initiative (PSI). Features NAViGaTOR combines a visualization system implemented in OpenGL with a graphical user interface and analytical algorithms implemented in Java.
In protein-protein interaction networks, nodes represent proteins, and edges between nodes represent physical interactions between the proteins. NAViGaTOR is under active development by members of Jurisica Lab of the Ontario Cancer Institute. Large-scale RDF Graph Visualization Tools. AI3 Assembles 26 Candidate Tools The pending UMBEL subject concept “backbone” ontology will involve literally thousands of concepts.
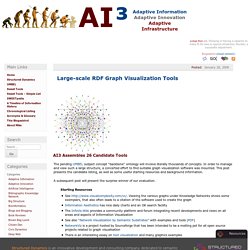
In order to manage and view such a large structure, a concerted effort to find suitable graph visualization software was mounted. This post presents the candidate listing, as well as some useful starting resources and background information. A subsequent post will present the surprise winner of our evaluation. Starting Resources Various Example Visualizations.
Open Source (OSS) Tools - WikiViz. A comparative study of social network analysis tools. Tutorials. KungfUX Master. Ariel Linkedin, twitter, Racionalidad ¿Qué es racionalidad?

Racionalidad en la RAERacional en la RAE. Information & Visualization. Statistical Views KNIME is a modular data mining platform with a focus on interactive exploration. I substantially improved this feature with a (sub-)framework realizing general visualization features. Based on this framework I implemented seven statistical views: scatter plot, scatter matrix, line plot, box plot, parallel coordinates, a dendrogram, and 2D rule plot.
Almost all KNIME views are now based on this framework. See also this blog entry. Learning Center. Which version should you use?

Piccolo2D In Comparison will explain the differences between Piccolo2D.Java and Piccolo2D.NET as well as how Piccolo2D relates to other Graphics Toolkits. Where's the research? If you want to understand what lead to Piccolo2D, read some of the papers we have published over the years in the Publications section. Have a technical question about Piccolo2D? Check out the Developer's FAQ for answers to frequently asked questions about all three versions of Piccolo2D. Still have questions? If you couldn't find the answer to your question on the Development FAQ, try submitting it to our Mailing Lists. Need to brush up on 2D Graphics? Documentation. GGobi data visualization system. Gapminder: Unveiling the beauty of statistics for a fact based world view. Principal Manifolds for Data Visualization and Dimension Reduction. New approaches to NLPCA, principal manifolds, branching principal components and topology preserving mappings are described Presentation of algorithms is supplemented by case studies In 1901 Karl Pearson invented Principal Component Analysis (PCA).

Since then, PCA serves as a prototype for many other tools of data analysis, visualization and dimension reduction: Independent Component Analysis (ICA), Multidimensional Scaling (MDS), Nonlinear PCA (NLPCA), Self Organizing Maps (SOM), etc. The book starts with the quote of the classical Pearson definition of PCA and includes reviews of various methods: NLPCA, ICA, MDS, embedding and clustering algorithms, principal manifolds and SOM. Data Visualization: Modern Approaches - Smashing Magazine. About The Author Vitaly Friedman loves beautiful content and doesn’t like to give in easily. Data visualization. Data visualization or data visualisation is viewed by many disciplines as a modern equivalent of visual communication.
It is not owned by any one field, but rather finds interpretation across many (e.g. it is viewed as a modern branch of descriptive statistics by some, but also as a grounded theory development tool by others). It involves the creation and study of the visual representation of data, meaning "information that has been abstracted in some schematic form, including attributes or variables for the units of information".[1]