
Flot - Attractive Javascript plotting for jQuery. Google Chart Tools. Google Charts provides a perfect way to visualize data on your website. From simple line charts to complex hierarchical tree maps, the chart gallery provides a large number of ready-to-use chart types. The most common way to use Google Charts is with simple JavaScript that you embed in your web page. You load some Google Chart libraries, list the data to be charted, select options to customize your chart, and finally create a chart object with an id that you choose. Then, later in the web page, you create a <div> with that id to display the Google Chart.
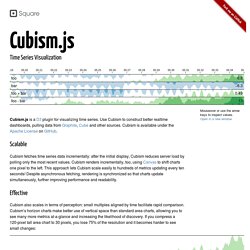
That's all you need to get started. d3.js. Cubism.js. Time Series Visualization foo7.6 bar−6.2 foo + bar1.4 foo - bar14 Cubism.js is a D3 plugin for visualizing time series.

Morris.js.