
Data Visualization and Infographics Resources. Advertisement Data visualizations and infographics can make complex datasets easier to understand and comprehend.
By creating a graphical represenatation of data and statistics, complicated concepts and information can make more sense in less time. Many visualizations focus on representing a specific set of data or statistical information. Others focus on less-concrete topics, providing a visual representation of abstract concepts. Generally speaking, the first type appear more like graphs or charts and the latter are often more creative and imaginative. Many Eyes. 10 badass social media visualisations. When it comes to social media you might be busy trying to separate the opportunity from the bullshit, such are the interstellar levels of hype and associated jargon that are plaguing this space.
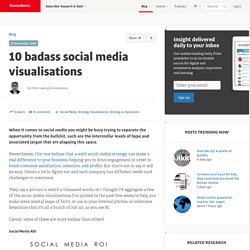
Nevertheless, I for one believe that a solid social media strategy can make a real difference to your business, helping you to drive engagement in order to boost customer satisfaction, retention, and profits. But that's not to say it will be easy: there's a lot to figure out and each company has different needs (and challenges to overcome). They say a picture is worth a thousand words, so I thought I'd aggregate a few of the social media visualisations I've spotted in the past few weeks to help you make some mental leaps of faith, or use in your internal pitches, or otherwise determine that it's all a bunch of hot air, as you see fit.
Caveat: some of these are more badass than others! Introducing News Dots - By Chris Wilson - Slate Magazine.