
A digital reimagining of Gettysburg - Anne Knowles. Memorial Day is a US federal holiday wherein the men and women who died while serving in the United States Armed Forces are remembered.The holiday, which is celebrated every year on the final Monday of May, was formerly known as Decoration Day and originated after the American Civil War to commemorate the Union and Confederate soldiers who died in the Civil War.

By the 20th century, Memorial Day had been extended to honor all Americans who have died while in the military service. It typically marks the start of the summer vacation season, while Labor Day marks its end.The muffled drum's sad roll has beat The soldier's last tattoo; No more on Life's parade shall meet That brave and fallen few. On Fame's eternal camping-ground 5 Their silent tents are spread, And Glory guards, with solemn round, The bivouac of the dead. Welcome To Opticks - Opticks - Opticks Wiki. GeoTech Community College Geospatial Educators. The National GeoTech Center (NGTC), in partnership with Southwestern College (SWC) and San Diego State University (SDSU), host - summerworkshop2014announcement-v4_2.pdf. GeoTech Center - HOME. An Introduction to Geodetic Datums. About. Mapping for Understanding Our Changing World - joseph-kerski.pdf.
TEDx Talks. Musician Scott Mescudi, aka Kid Cudi, returns to his high school to talk about growing up and his career path in the music industry.

Born Scott Ramon Seguro Mescudi in Cleveland, Kid Cudi began rapping while attending Shaker Heights High School and later Solon High School. In 2004, Kid Cudi moved to Brooklyn, NY to pursue his rap career. He released his first mixtape, “A Kid Named Cudi,” in 2008. The mixtape earned Kanye West’s attention, leading him to sign Cudi to his GOOD Music imprint. Maps and GIS resources to serve the interests of the region. Geographic Information Systems (GIS): Dan Scollon at TEDxRedding. Welcome - GeoTech Center. GeoTech Center - HOME. GTCM Curriculum Guide 2.0 - GeoTech Center. Gistech_andsuppurisajournalvol22issue2.pdf. National Atlas and Map to Merge into One Source : Geospatial Solutions. During this year, National Atlas of the United States and The National Map will transition into a combined single source for geospatial and cartographic information.
Making History...GIS and Women. Mexican drug trafficking in the US: the Sinaloa cartel's vast empire.
The Nature of Geographic Information. An Open Geospatial Textbook David DiBiase with contributions by James L.
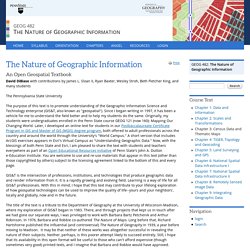
Sloan II, Ryan Baxter, Wesley Stroh, Beth Fletcher King, and many students The Pennsylvania State University The purpose of this text is to promote understanding of the Geographic Information Science and Technology enterprise (GIS&T, also known as "geospatial"). Since I began writing in 1997, it has been a vehicle for me to understand the field better and to help my students do the same. GIS&T is the intersection of professions, institutions, and technologies that produce geographic data and render information from it.
Maps and the Geospatial Revolution. About the Course The past decade has seen an explosion of new mechanisms for understanding and using location information in widely-accessible technologies.
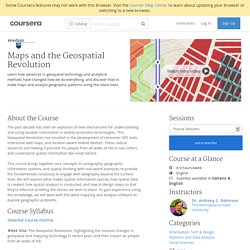
This Geospatial Revolution has resulted in the development of consumer GPS tools, interactive web maps, and location-aware mobile devices. These radical advances are making it possible for people from all walks of life to use, collect, and understand spatial information like never before. This course brings together core concepts in cartography, geographic information systems, and spatial thinking with real-world examples to provide the fundamentals necessary to engage with Geography beyond the surface-level. We will explore what makes spatial information special, how spatial data is created, how spatial analysis is conducted, and how to design maps so that they’re effective at telling the stories we wish to share. Maps and the Geospatial Revolution: Latest Course from Coursera.org. Home / Career • Featured / Maps and the Geospatial Revolution: Latest Course from Coursera.org.
Profiles from the Geospatial Community. Mark Greninger has been the Geographic Information Officer (GIO) for Los Angeles County since 2006.
In this latest Profiles from the Geospatial Community installment, Greninger shares his thoughts about the field of GIS. 1. Los Angeles County Enterprise GIS. Los Angeles County Enterprise GIS. By markgreninger, on December 5th, 2013 For those of you who would like to relive GIS Day 2013, I’ve posted some pictures from GIS Day 2013.
If you have some pictures that you would like to add, please contact me. To help make our event better, please fill out our GIS Day Survey! See you next year! By Nick Franchino, on November 21st, 2013 We couldn’t have had as successful an event as we did without the help of our sponsors. Thanks again to the County departments that put on the event as well – especially our Internal Services Department (ISD).
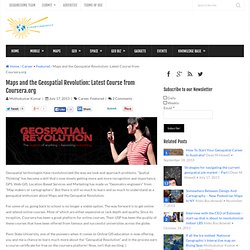
More pictures to follow soon. By markgreninger, on November 21st, 2013. Cal Gis. Geoportal. Directions Magazine - GIS News and Geospatial. URISA - URISA. Southern California Government GIS User Group – Working together locally in GIS. Publicradiomap. City of Los Angeles - GIS. These Maps Redraw Cities Based On How Long It Takes To Get Around Without A Car. How much time will it take to reach point X by foot or public transit?
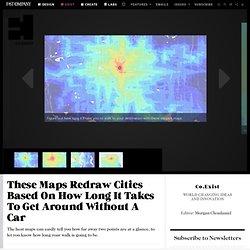
That's the question that these elegant maps try to answer. Rather than plug in addresses on Google Maps, you simply click on a point and see a heat-map visualization from your current location. Red means 10 minutes. Yellow means 20 or 30 minutes. Green and blue take a bit longer.The maps were developed by Andrew Hardin, a graduate student at the University of Colorado. Here is San Francisco: Seattle: Denver: And Boulder, Colorado: "These maps show how long it takes to get everywhere else via walking and public transit," Hardin writes in an email.
Hardin says the maps change dramatically according to the time of day, as you can see from this animation for Boulder. Hardin's maps, which are based on Open Street Map data, aren't completely accurate. Stewart Bruce.
Unit 158 - Teaching GIS.