
Statosphère, les statistiques du web et d'ailleurs. 37 Data-ish Blogs You Should Know About. You might not know it, but there are actually a ton of data and visualization blogs out there.
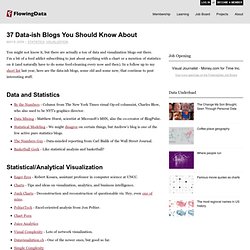
I'm a bit of a feed addict subscribing to just about anything with a chart or a mention of statistics on it (and naturally have to do some feed-cleaning every now and then). In a follow up to my short list last year, here are the data-ish blogs, some old and some new, that continue to post interesting stuff. Data and Statistics By the Numbers - Column from The New York Times visual Op-ed columnist, Charles Blow, who also used to be NYT's graphics director.Data Mining - Matthew Hurst, scientist at Microsoft's MSN, also the co-creator of BlogPulse.Statistical Modeling - We might disagree on certain things, but Andrew's blog is one of the few active pure statistics blogs.The Numbers Guy - Data-minded reporting from Carl Bialik of the Wall Street Journal.Basketball Geek - Like statistical analysis and basketball? Statistical/Analytical Visualization Maps Design & Infographics Others Worth Noting.
27 Visualisations comprendre la crise financiere. I've said it before, and I'll say it again.
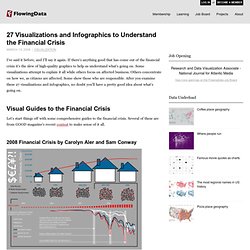
If there's anything good that has come out of the financial crisis it's the slew of high-quality graphics to help us understand what's going on. Some visualizations attempt to explain it all while others focus on affected business. Others concentrate on how we, as citizens are affected. Some show those who are responsible. After you examine these 27 visualizations and infographics, no doubt you'll have a pretty good idea about what's going on. Visual Guides to the Financial Crisis Let's start things off with some comprehensive guides to the financial crisis. 2008 Financial Crisis by Carolyn Aler and Sam Conway A Visual Guide to the Financial Crisis by Jess Bachman Jess from WallStats put this together for the Mint blog.
The Global Finanical Crisis by Cypher 13 Where Did All the Money Go? From Feliciano Rahardjo Looks like the beginning of a comic book. A Closer Look at the Global Financial Crisis by Liam Johnstone The Global Money Mess by Karen Ong. 20 Visualisations Données Criminalité (USA) There's a lot of crime data.
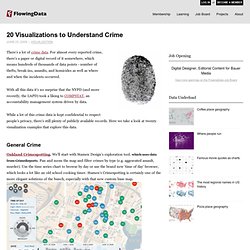
For almost every reported crime, there's a paper or digital record of it somewhere, which means hundreds of thousands of data points - number of thefts, break-ins, assaults, and homicides as well as where and when the incidents occurred. With all this data it's no surprise that the NYPD (and more recently, the LAPD) took a liking to COMPSTAT, an accountability management system driven by data. While a lot of this crime data is kept confidential to respect people's privacy, there's still plenty of publicly available records. Here we take a look at twenty visualization examples that explore this data. General Crime Oakland Crimespotting. CrimeReports. Everyblock. Archives visalisations données. Libérons les données ! Il me parait tous les jours plus clair que nos amis les données veulent partir en vacance.
Ce besoin de voyage est d’autant plus fort que le coût d’un trajet numérique Boston / Bangalore tend vers zéro. Et puis après tout, n’est ce pas dans notre nature de partager, copier, diffuser l’information ? Nous sommes des primates, nous apprenons par mimétisme. Et dans un monde hautement interconnecté et numérique, où il n’a jamais été aussi simple d’apprendre et de partager, notre nature reprend le dessus. Je crois profondément que nous sommes à l’aube d’une ère nouvelle.
Malheureusement (heureusement?) Le monde change vite, trop vite. Et dans tout ça. Pour compléter cet article j’ai republié cet excellent reportage: La discussion est ouverte. share.