
Custom Message Interceptor. This sample demonstrates the use of the channel extensibility model.
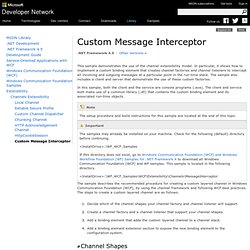
In particular, it shows how to implement a custom binding element that creates channel factories and channel listeners to intercept all incoming and outgoing messages at a particular point in the run-time stack. The sample also includes a client and server that demonstrate the use of these custom factories. In this sample, both the client and the service are console programs (.exe). The client and service both make use of a common library (.dll) that contains the custom binding element and its associated run-time objects. The sample describes the recommended procedure for creating a custom layered channel in Windows Communication Foundation (WCF), by using the channel framework and following WCF best practices. Decide which of the channel shapes your channel factory and channel listener will support. The sample defines a custom binding element: InterceptingBindingElement. <configuration> ... Building your own NPM repository mirror - Qwiple.
If you spend any of your time building software with NodeJS you've probably noticed recently that the NPM repository can be flaky some days and completely down others.
This presents a significant challenge, as NPM is a hard-requirement for deploying your application to a new server, not to mention day-to-day coding that includes bringing packages into your project whenever you need them. One option to consider is creating a mirror of the public NPM repository. The data is stored in CouchDB so it's fairly straightforward to set up a replica of the database and have it continuously sync from the mother ship. NuGet Package of the Week #9 - ASP.NET MiniProfiler from StackExchange rocks your world. Advanced ASP.NET Logging and Tracing - SmartInspect. Find bugs, solve customer issues and improve the reliability of your web applications with SmartInspect, our advanced and high-performance logging tool for .NET applications.
Easily create log files, trace method execution or track threads and processes with our reliable logging library. Analyze log files, monitor your ASP.NET web applications in real-time and use flexible filters and navigation tools with our log viewer application, the SmartInspect Console. Adding logging to your web application The SmartInspect libraries enable you to create detailed logs of your web applications.
You can log simple messages, variable values, errors, exceptions and even any arbitrary object. Diagnostics and Logging In ASP.NET. Before our application reaches production we need a plan to deal with errors, performance problems, and other unexpected behaviors.
The ability to record and retrieve diagnostic information is an important characteristic of robust software. Diagnostic information could include the amount of time needed to execute a critical method, the number of transactions committed per second, or the number of users currently with active sessions. There are many features built into ASP.NET and the operating system to make acquiring and distributing this diagnostic information easy. Some applications however, will need to augment the built-in features with additional functionality.
This article will discuss the strengths and weaknesses of various diagnostic information sources, and techniques for publishing the information. Make A List, Check It Twice Before deciding on what information to capture and publish we need to think about what our information needs will be. Meeting the Requirements Event Log. Diagnostics and Logging In ASP.NET. Overview of ASP.NET Performance Monitoring. Updated: August 22, 2005 Applies To: Windows Server 2003, Windows Server 2003 R2, Windows Server 2003 with SP1.
Monitoring ASP.NET Application Performance. The topic you requested is included in another documentation set.
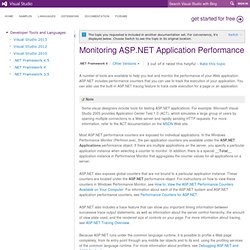
For convenience, it's displayed below. Choose Switch to see the topic in its original location. A number of tools are available to help you test and monitor the performance of your Web application. ASP.NET includes performance counters that you can use to track the execution of your application. Testing - What are the best ASP.NET performance counters to monitor. ASP.NET and Performance - ASP.NET Debugging. I wanted to talk about monitoring performance in ASP.NET for a bit.
I have already posted a few postings that talk around this issue, namely: Profiling - Debugging @ SharpToolbox. .NET Framework and .NET SDK Downloads. Buy .NET Memory Profiler. .NET Memory Profiler is licensed per named user.
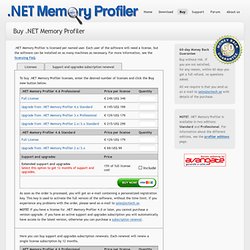
Each user of the software will need a license, but the software can be installed on as many machines as necessary. For more information, see the licensing FAQ. ASP.NET Tips: Finding what is taking up memory - ASP.NET Debugging. There are some times that you want to figure out what is taking up your memory.
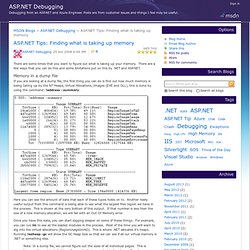
There are a few ways that you can do this and some limitations put on this by .NET and ASP.NET. Memory in a dump file If you are looking at a dump file, the first thing you can do is find out how much memory is being taking up by the NT Heaps, Virtual Allocations, Images (EXE and DLL), this is done by using the command: ! Address –summary: Here you can see the amount of data that each of these types holds on to. Once you have this data, you can start digging deeper on some of these things.
Note: In a dump file, we cannot figure out the sizes of all individual pages. Memory in a live process To look at memory in a live process, there are a number of different tools you can use depending on the situation.