
Revision Guru. The Government can raise the level of its own spending.
This "fiscal pump-priming" directly increases aggregate demand and can have a multiplier effect on equilibrium national income. The government could raise current expenditure (for example raising pay levels in education and the health service) or expand spending on capital projects which add to the stock of capital (for example spending on new roads, new hospitals or other major infrastructural projects). A reduction in direct taxation increases consumers' disposable income and should boost household spending. The effect may be greater if taxes are cut for people on lower than average incomes. These tax-payers are likely to spend a greater percentage of their disposable income. Labour market failures. Labour market failures Like product markets, labour markets can also fail.

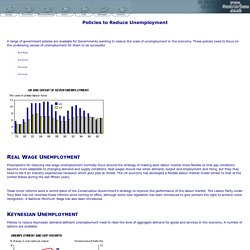
The main types of labour market failure are the existence of skills gaps, poaching, labour immobility and inequality. Skills gaps, training and poaching The theory of poaching suggests it will not benefit firms to provide workers with general skills that can be transferred from job to job. Firms are more likely to wait for other firms to spend money on training, and then poach workers with higher salaries, which they can afford because they have spent less on training. Therefore, in free markets, there is likely to be a skills gap, because insufficient levels of general skills, such as literacy, numeracy and IT skills, will be provided by private firms. Remedies Because there is little incentive for firms to train workers in general skills, the government can compensate by: AS Macro Key Term: Seasonal Unemployment. Demand Side Unemployment and Inflation. Readers Question: “To what extent can government use demand management policies to reduce unemployment without affecting inflation?”

(60) Demand side unemployment is known as demand-deficient or cyclical unemployment. It is the unemployment that occurs due to an economic slowdown / recession. In a recession, there is a fall in output and this leads to lower demand for workers. Demand Side Unemployment and Inflation. Unemployment and employment - Revisionguru. Often you will be told that anybody without a job is unemployed, in economics this simply is not true.
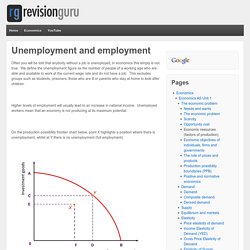
We define the unemployment figure as the number of people of a working age who are able and available to work at the current wage rate and do not have a job. This excludes groups such as students, prisoners, those who are ill or parents who stay at home to look after children. Higher levels of employment will usually lead to an increase in national income.
Unemployed workers mean that an economy is not producing at its maximum potential. On the production possibility frontier chart below, point X highlights a position where there is unemployment, whilst at Y there is no unemployment (full employment). Difference between Voluntary and Involuntary Unemployment. Voluntary Unemployment Definition. Regional Unemployment in UK. Readers Question: Why are there large differences in the unemployment rate across different regions of the UK?
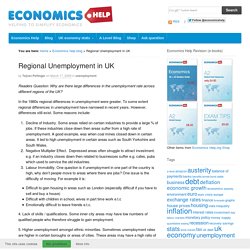
In the 1980s regional differences in unemployment were greater. To some extent regional differences in unemployment have narrowed in recent years. However, differences still exist. Some reasons include: Decline of Industry. 4. 5. Animated Graph of Unemployment Rate by Region [Adobe Flash] Unemployment rates over time. Key points Though unemployment in London has been higher than rest of England for more than 15 years, the gap between London and the rest of England is much lower now.In 2011, unemployment in London was back up at levels last seen in the late 1990s.
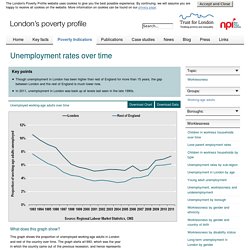
What does this graph show? This graph shows the proportion of unemployed working-age adults in London and rest of the country over time. The graph starts at1993, which was the year in which the country came out of the previous recession, and hence represents an appropriate starting point. In 2011, around 7% of working-age adults in London were unemployed, similar to the levels last seen in the late 1990s. Claimant Count. <div id="ia-noscript-container"> This <a href=" report requires JavaScript.

Please enable JavaScript to view this page properly. </div> Powered By InstantAtlas™ © Crown Copyright 2014 Clear Filter Percentage Claimant Count Unemployed Monthly (1992-2015) Data Supplier: Economic Labour Market Statistics (NISRA) Email: claimantcount@dfpni.gov.uk Twitter: @ELMSNISRA View latest Labour Market Statistics Local Government District 2014 *not seasonally adjusted Northern Ireland. Unemployment Rate, Region - Datasets - London DataStore. Unemployment numbers and rates for those aged 16 or over.
The unemployed population consists of those people out of work, who are actively looking for work and are available to start immediately. Unemployed numbers and rates also shown for equalities groups, by age, sex, ethnic group, and disability. Economic inactivity rates and numbers for regions. The data are taken from the Labour Force Survey and Annual Population Survey, produced by the Office for National Statistics. The data are produced monthly on a rolling quarterly basis. International Labour Organization define unemployed people as: without a job, want a job, have actively sought work in the last 4 weeks and are available to start work in the next 2 weeks, or, out of work, have found a job and are waiting to start it in the next 2 weeks.