
Tagxedo - Word Cloud with Styles. Webpages as graphs - an HTML DOM Visualizer Applet. Websites as graphs. Everyday, we look at dozens of websites.
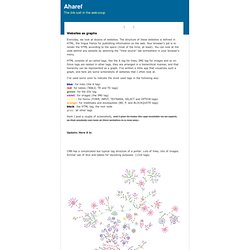
The structure of these websites is defined in HTML, the lingua franca for publishing information on the web. Your browser's job is to render the HTML according to the specs (most of the time, at least). You can look at the code behind any website by selecting the "View source" tab somewhere in your browser's menu. HTML consists of so-called tags, like the A tag for links, IMG tag for images and so on. Since tags are nested in other tags, they are arranged in a hierarchical manner, and that hierarchy can be represented as a graph. I've used some color to indicate the most used tags in the following way: blue: for links (the A tag)red: for tables (TABLE, TR and TD tags)green: for the DIV tagviolet: for images (the IMG tag)yellow: for forms (FORM, INPUT, TEXTAREA, SELECT and OPTION tags)orange: for linebreaks and blockquotes (BR, P, and BLOCKQUOTE tags)black: the HTML tag, the root nodegray: all other tags Update: Here it is: cnn.com boingboing.net.
Brainstorm and mind map online. Werkenmetweb2 - Mindmapping. 12 Inspiring Visual Search Engines - jeffthomastechsite. 12 Inspiring Visual Search Engines We all know that a picture is worth a thousand words.
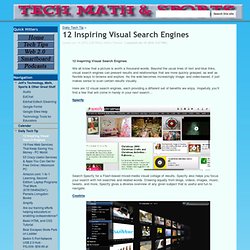
Beyond the usual lines of text and blue links, visual search engines can present results and relationships that are more quickly grasped, as well as flexible ways to browse and explore. As the web becomes increasingly image- and video-based, it just makes sense to scan certain results visually. Here are 12 visual search engines, each providing a different set of benefits we enjoy. Hopefully you’ll find a few that will come in handy in your next search… Spezify Search Spezify for a Flash-based mixed-media visual collage of results. Cooliris The Cooliris plugin transforms searches across Google Images, Bing, Flickr, Hulu, YouTube, Amazon and others into a beautiful, interactive 3D wall. SpaceTime Originally a 3D browser, SpaceTime is now a visual search engine. Jinni With many visual search engines, the innovation starts with the way results are presented. Viewzi NeXplore EyePlorer Quintura LivePlasma Ujiko Ziipa.
A visual exploration on mapping complex networks. Bookmatching brengt backlist terug in beeld. December 2008 D I S C U S S I E S T U K N R . 5 © stichting Auteursdomein (overname met bronvermelding toegestaan) 'Koninklijke Bibliotheek of Bureau ISBN moet boekenbrowser beheren' 'Bookmatching' brengt backlist terug in beeld Goed nieuws voor de backlist: de 'matching machines' komen eraan.
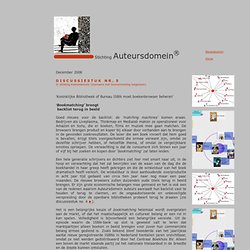
Bedrijven als Liveplasma, Thinkmap en Medialab maken ze operationeel voor Amazon en Sony, die er boeken, flims en muziek mee gaan matchen. Een hele generatie schrijvers en dichters ziet hier met smart naar uit, in de hoop en verwachting dat het zal bevrijden van de waan van de dag die de boekhandel in haar greep heeft gekregen en die de winkelduur van het boek dramatisch heeft verkort. Het is een belangrijke keuze of bookmatching helemaal wordt overgelaten aan de markt, of dat het maatschappelijk en cultureel belang er een rol in kan spelen. Betrouwbaarheid is een andere vereiste.
Wat de recensies aangaat is het begrijpelijk maar ook jammer dat de dagbladen hun materiaal niet vrijgeven. P.v/dV.'08. Expression of Interest. Expression of Interest is a project of the Visualization group of the faculty of Mathematics and Computer Science, Technische Universiteit Eindhoven.
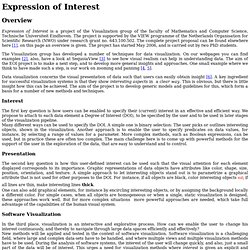
The project is supported by the VIEW programme of the Netherlands Organisation for Scientific Research (NWO) under research grant no. 643.100.502. The complete project proposal can be found elsewhere here [1], on this page an overview is given. The project has started May 2006, and is carried out by two PhD students. The Visualization group has developed a number of techniques for data visualization. On our webpages you can find examples [2], also, have a look at SequoiaView [3] to see how visual realism can help in understanding data. Data visualization concerns the visual presentation of data such that users can easily obtain insight [6]. The first key question is how users can be enabled to specify their (current) interest in an effective and efficient way.
Many different ways can be used to specify the DOI. Evaluation and guidelines. Graph Visualization for the Web. Thinkmap visualization software facilitates communication, learning, and discovery. Thinkmap Visual Thesaurus - An online thesaurus and dictionary of over 145,000 words that you explore using an interactive map. Synonym - WordNet visualization using Force-Directed Graphs. About WordNet - WordNet - About WordNet.
JavaScript Visual Wordnet. Human brain cloud. Fast Analytics and Rapid-fire Business Intelligence from Tableau Software.