
Data journalism pt5: Mashing data (comments wanted) This is a draft from a book chapter on data journalism (part 1 looks at finding data; part 2 at interrogating data; part 3 at visualisation, and 4 at visualisation tools).
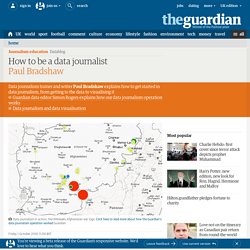
I’d really appreciate any additions or comments you can make – particularly around tips and tools. UPDATE: It has now been published in The Online Journalism Handbook. Mashing data. Playing with heat-mapping UK data on OpenHeatMap. Last night OpenHeatMap creator Pete Warden announced that the tool now allowed you to visualise UK data . I’ve been gleefully playing with the heat-mapping tool today and thought I’d share some pointers on visualising data on a map.
This is not a tutorial for OpenHeatMap – Pete’s done a great job of that himself (video below) – but rather an outline of the steps to get some map-ready data in the first place. [youtube: OpenHeatMap. How to be a data journalist. Data journalism is huge.
I don't mean 'huge' as in fashionable - although it has become that in recent months - but 'huge' as in 'incomprehensibly enormous'. It represents the convergence of a number of fields which are significant in their own right - from investigative research and statistics to design and programming. The idea of combining those skills to tell important stories is powerful - but also intimidating. Who can do all that? The reality is that almost no one is doing all of that, but there are enough different parts of the puzzle for people to easily get involved in, and go from there. 1. 'Finding data' can involve anything from having expert knowledge and contacts to being able to use computer assisted reporting skills or, for some, specific technical skills such as MySQL or Python to gather the data for you. 2. 3. 4.
Tools such as ManyEyes for visualisation, and Yahoo! How to Scrape Websites for Data without Programming Skills. Searching for data to back up your story?
Just Google it, verify the accuracy of the source, and you’re done, right? Not quite. Accessing information to support our reporting is easier than ever, but very little information comes in a structured form that lends itself to easy analysis. You may be fortunate enough to receive a spreadsheet from your local public health agency. But more often, you’re faced with lists or tables that aren’t so easily manipulated. It’s not enough to copy those numbers into a story; what differentiates reporters from consumers is our ability to analyze data and spot trends. It often takes a lot of time and effort to produce programs that extract the information, so this is a specialty.
Enter OutWit Hub, a downloadable Firefox extension that allows you to point and click your way through different options to extract information from Web pages. How to use OutWit Hub When you fire it up, there will be a few simple options along the left sidebar. Data Scraping Wikipedia with Google Spreadsheets. Prompted in part by a presentation I have to give tomorrow as an OU eLearning community session (I hope some folks turn up – the 90 minute session on Mashing Up the PLE – RSS edition is the only reason I’m going in…), and in part by Scott Leslie’s compelling programme for a similar duration Mashing Up your own PLE session (scene scetting here: Hunting the Wily “PLE”), I started having a tinker with using Google spreadsheets as for data table screenscraping.
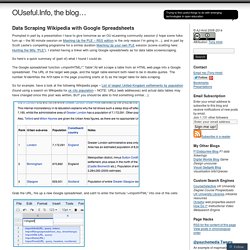
So here’s a quick summary of (part of) what I found I could do. The Google spreadsheet function =importHTML(“”,”table”,N) will scrape a table from an HTML web page into a Google spreadsheet. The URL of the target web page, and the target table element both need to be in double quotes. The number N identifies the N’th table in the page (counting starts at 0) as the target table for data scraping. Grab the URL, fire up a new Google spreadsheet, and satrt to enter the formula “=importHTML” into one of the cells: =ImportHtml(“ Why CSV? Data Journalism. As our governments and businesses become increasingly flush with information, more and bigger data are becoming available from across the globe.

Increasingly, investigative reporters need to know how to obtain, clean, and analyze “structured information” in this digital world. Here is a list of resources to get you started, but we want to keep updating our community with the best resources available. Do you know of a great data tutorial we haven't listed, perhaps in a language other than English? Help us keep this resource guide comprehensive by sending your favorite resource to: hello@gijn.org. ¿Habla español? Key Resources The National Institute for Computer-Assisted Reporting, a project of Investigative Reporters and Editors, launched in 1989 to train reporters around the world on how to use data as part of broader investigations. Poynter offers Five Tips for getting started with computer-assisted reporting, and 10 Tools to analyze datasets more efficiently.
Periodismo de Base de Datos. Periodismo de Base de Datos.