
Eclipse BIRT. What is open source software?

Open source software is computer software that allows its source code to be made publicly available or open for anyone to use for any objective. Thus, any person can view, learn, apply, alter, and circulate the source code without having to worry about violating the normal copyright restrictions of protected or licensed software. With little to no copyright limitations, open source software encourages user-generated content to be developed in a public, collaborative effort. The notion of unrestricted sharing has been adopted by open source software in order to ensure perpetual access to all resulting or derivative creations. Eclipse BIRT Open Source Reporting Tool Monthly summary report design created by BIRT Designer open source reporting software. Spotfire « Data Visualization. Comparison of DV Tools is the most popular page (and post) of this site, visited by many thousands of people.

Some of them keep asking to append this comparison with different additional features, one of them is a comparison of requirements of leading DV tools for file and memory footprint and also for reading and saving time. I took mid-sized dataset (428999 rows and 135 columns), exported it into CSV and compressed it to ZIP format, because all native DV formats (QVW by Qlikview, DXP by Spotfire, TWBX by Tableau and XLSX by Excel and PowerPivot) are compressed one way or another. My starting filesize (of ZIPped dataset) was 56 MB.
Here is what I got, see for yourself: One comment is that numbers above are all relative to configuration of hardware used for tests and also depend on other software I ran during tests, because that software also requires RAM, CPU cycles, disk I/O and even on speed of repainting applications windows on screen, especially for Excel.
Tableau Software on Big Data Visualization. Seattle-based Tableau Software is a data visualization company making some big waves in the world of Big Data. Daniel Jewitt, the VP of Tableau Software shared his company’s history and Big Data story on theCube at Strata-Hadoop World 2012. The company was founded back in 2003 as a tech spin-off of a Stanford University PHD project funded by the Department of Defense. Pat Hanrahan, the famed Pixar engineer was approached by the DOD to aid in visualization of their enormous data environments.
Today the Tableau product provides insightful visualization based on queries within the realms of relational databases, unstructured data, and Big Data. Tableau’s mission is to help people see and access data. Data is useless if it cannot be understood, and thus a gap is often formed. Tableau has a vision for the long term, and envisions a pervasive trajectory. Case Study: Windows Azure - Tableau Software. Tableau Software. Tableau Software (/tæbˈloʊ/ tab-LOH) is an American computer software company headquartered in Seattle, WA, USA.

It produces a family of interactive data visualization products focused on business intelligence.[1] History[edit] In 2010, Tableau reported revenue of $34.2 million dollars. That figure grew to $62.4 million in 2011 and $127.7 million in 2012. Profit during the same periods came to $2.7 million, $3.4 million, and $1.6 million, respectively.[9] Shares of Tableau Software started trading on the New York Stock Exchange after an initial public offering on May 17, 2013. Products[edit] Tableau offers five main products: Tableau Desktop, Tableau Server, Tableau Online, Tableau Reader and Tableau Public.
Awards and Industry Recognition[edit] Withdrawal of services from Wikileaks[edit] External links[edit]
Magic Quadrant for Business Intelligence and Analytics Platforms. Perch by Closely - The App for Small Businesses. Page Flip. Adobe File Share and Meeting Space. Data Wrangler. UPDATE: The Stanford/Berkeley Wrangler research project is complete, and the software is no longer actively supported.
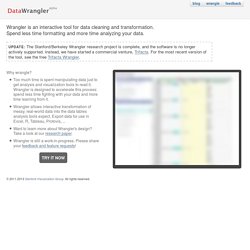
Instead, we have started a commercial venture, Trifacta. For the most recent version of the tool, see the free Trifacta Wrangler. Why wrangle? Too much time is spent manipulating data just to get analysis and visualization tools to read it. Wrangler is designed to accelerate this process: spend less time fighting with your data and more time learning from it.
Tools to Display Information.