
Create an Aggregate Report using Report Designer and the Analysis Services Cube. You can track your team's progress more easily by creating reports that aggregate data from Visual Studio Application Lifecycle Management (ALM) (TFS) into charts and tables.
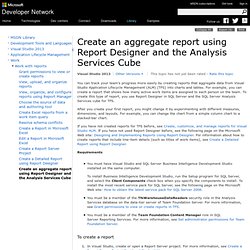
For example, you can create a report that shows how many active work items are assigned to each person on the team. To create this type of report, you use Report Designer in SQL Server and the SQL Server Analysis Services cube for TFS. After you create your first report, you might change it by experimenting with different measures, dimensions, and layouts. For example, you can change the chart from a simple column chart to a stacked-bar chart. If you have not created reports for TFS before, see Create, customize, and manage reports for Visual Studio ALM. Requirements You must have Visual Studio and SQL Server Business Intelligence Development Studio installed on the same computer. To create a report In Visual Studio, create or open a Report Server project. To create the query that will retrieve the data for the report.
Design Considerations for Report Rendering. This topic explains important differences in how rendering extensions are used and includes a list of topics that explain how each rendering extension processes a report definition.
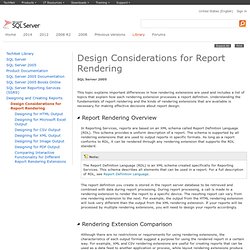
Understanding the fundamentals of report rendering and the kinds of rendering extensions that are available is necessary for making effective decisions about report design. In Reporting Services, reports are based on an XML schema called Report Definition Language (RDL). This schema provides a uniform description of a report. The schema is supported by all rendering extensions that are used to output reports in specific formats. As long as a report conforms to RDL, it can be rendered through any rendering extension that supports the RDL standard. The report definition you create is stored in the report server database to be retrieved and combined with data during report processing. The following rendering extension taxonomy shows how extensions vary in pagination behavior and the degree of interactivity. Michael Coles: Sergeant SQL : Parent-Child Build Scripts with SQLCMD.
On the SQL Server public programming newsgroup someone recently posted a question about an SSMS error ("Cannot parse script. 'System.OutOfMemoryException' thrown.
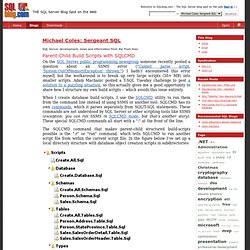
") I hadn’t encountered this error myself, but the workaround is to break up very large scripts (50+ MB) into smaller scripts. Adam Machanic posted a T-SQL Tuesday challenge to post a solution to a puzzling situation, so this actually gives me a good opportunity to share how I structure my own build scripts -- which avoids this issue entirely. When I create database build scripts, I use the SQLCMD utility to run them from the command line instead of using SSMS or another tool.
SQLCMD has its own commands, which it parses separately from SQL/T-SQL statements. The SQLCMD command that makes parent-child structured build-scripts possible is the ":r" or "run" command, which tells SQLCMD to run another script file from within the current script file. The \Scripts directory contains a Create.All.Sql script. /* Create All Items*/
A Visual Explanation of SQL Joins. I love the concept, though, so let's see if we can make it work.
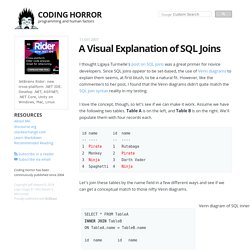
Assume we have the following two tables. Table A is on the left, and Table B is on the right. We'll populate them with four records each. id name id name -- ---- -- ---- 1 Pirate 1 Rutabaga 2 Monkey 2 Pirate 3 Ninja 3 Darth Vader 4 Spaghetti 4 Ninja Let's join these tables by the name field in a few different ways and see if we can get a conceptual match to those nifty Venn diagrams. There's also a cartesian product or cross join, which as far as I can tell, can't be expressed as a Venn diagram: SELECT * FROM TableA CROSS JOIN TableB This joins "everything to everything", resulting in 4 x 4 = 16 rows, far more than we had in the original sets.