
Weather Data: Temperature, Windspeed, Humidity, Air Pressure. ######################################################################### This Cacti Addon is for getting:# - Temperature Data# - Humidity# - Wind Speed# - Air Pressure# from the Locations you'd want Monitor (maybe Server Locations)# via Openweather graphed in Cacti########################################################################1)You need to have Python Modul 'simplejson' installed.
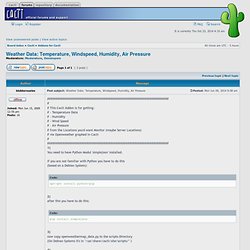
If you are not familiar with Python you have to do this(based on a Debian System): Code: apt-get install python-pip 2)after this you have to do this: pip install simplejson 3)now copy openweathermap_data.py to the scripts-Directory(On Debian Systems it's in "/usr/share/cacti/site/scripts/" ) 4)import the Templates in Cacti with "Import Templates" 5)The last point is an optical Feature, with CDEF-Functions for Temperature Graph You have to create 2 easy CDEF Functions,(maybe there will be an export Function for CDEF in future versions of Cacti too): go to "Graph Management" -> CDEFsclick on "Add"
Core Plot · GitHub. Polar chart. Tutorial:Windrose Graph - Howto Wiki. From Howto Wiki Summary Windrose graphs are used to present wind speed data and wind direction data collected over some time at a particular location.
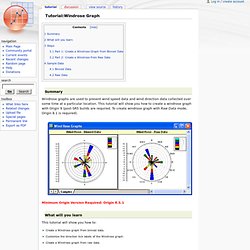
This tutorial will show you how to create a windrose graph with Origin 9 (post-SR5 builds are required. To create windrose graph with Raw Data mode, Origin 8.1 is required). Minimum Origin Version Required: Origin 8.5.1 What will you learn This tutorial will show you how to: Create a Windrose graph from binned data. Steps This tutorial is associated with the Statistical and Specialized Graphs project:\Samples\Statistical and Specialized Graphs.opj. Part 1: Create a Windrose Graph from Binned Data Go to the project folder Statistical and Specialized Graphs: Specialized: Wind Rose and activate the Windrose Binned Data workbook. Cgwindrose.pro (Coyote Graphics Routines) Graphics Examples Author information Author David W.
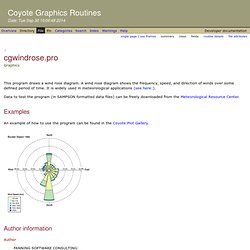
Fanning 1645 Sheely Drive Fort Collins, CO 80526 USA Phone: 970-221-0438 E-mail: david@idlcoyote.com Coyote's Guide to IDL Programming: Copyright Copyright (c) 2013, Fanning Software Consulting, Inc. History Change History: Written, 7 March 2013 by David W. Routines result = cgWindRoseArc(xcenter, ycenter, radius [, angle1] [, angle2]) This function returns 100 x and y points as a 2x100 array that forms an arc between two angles when plotted. result = cgWindRose_PositiveLabel(axis, index, value) This is a tick labeling function that prevents negative tick values. cgWindRose_ReadSamFile [, filename] [, SPEED=float] [, DIRECTION=float] Read a SAMSON format meteorological data file to obtain the wind speed and direction arrays.
Graphing weather data. For the past few years I have been running a couple of weather stations.
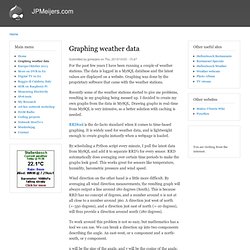
The data is logged in a MySQL database and the latest values are displayed on a website. Graphing was done by the proprietary software that came with the weather stations. Recently some of the weather stations started to give me problems, resulting in my graphing being messed up. I decided to create my own graphs from the data in MySQL. Drawing graphs in real-time from MySQL is very intensive, so a better solution with caching is needed. RRDtool is the de-facto standard when it comes to time-based graphing. By scheduling a Python script every minute, I pull the latest data from MySQL and add it to separate RRD's for every sensor. Wind direction on the other hand is a little more difficult. To work around this problem is not so easy, but mathematics has a tool we can use. X will be the sine of the angle, and y will be the cosine of the angle. x=sinθ y=cosθ This computation is done in Python. Rrdweather - A weather monitoring tool based on RRDtool and weather.com. We use RRDTool for the weather station!
We completed our weather station a few weeks ago.
Thats when I started working on a simple website, to display the received data. My first approach was to store the received samples in an SQL-database and to plot the data via Javascript. It worked fine for a few days, but when I tried to displayed all samples of a week / a month or a year I realized that this approach, was not going to work at all. Rendering all the samples for 1 year (every 5 seconds so 6311520) via Javascript does not work of course.
Just omitting data and taking one random value per day is also not a satisfying way of solving this. To solve this properly you would have to calculate min/max/average for longer timeframes – ideal would be to have more then 1 length for these periods (for example 30 min for a week and 1 day for a year).. I realized if i continued to use sql this was going to be a quite a big project. I was disappointed. What is RRD-Tool? RRD stands for Round Robin Database. Defining the Database The result.