
Ichimoku Kinko Hyo: A comprehensive guide by TraderSmokey. Reading the Ichimoku Kinko Hyo: Now that we’ve established what components build the Ichimoku system we’ll transition into talking about how to read the system and how the different components interacting with each other give different signals of varying strength.
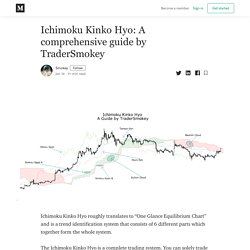
First we’ll lay out when the system is fully in sync and trend is the strongest. Reversal Chart Patterns. Candlestick Chart Patterns Part 2. Candlestick Chart Patterns Part 1. How To Create A Price Action Trading Strategy. Click here to get a PDF of this post What is a price action trading strategy?

When you abandon your own opinions and predictions and take a look at what the price action is telling you on the chart is when you go from guessing about the future to trading the present price action. Investors look at balance sheets to buy and sell based on the fundamental valuations of the underlying business. Traders looks at the buyers and sellers locations on the price chart to see what the short term and long term trend of the stock is or where the support and resistance of price is in a trading range. Here are the dynnamics needed to create your own price action trading strategy: Backtesting historical price action to see where entries and exits created big wins and small losses in the past.
TRADING EDGE 254 - Tools That HELP With Technical Analysis. Probabilities Of Price Action Inside Standard Deviations. Click here to get a PDF of this post Standard deviations are used to measure current price action in relation to the average price of a chosen time frame.
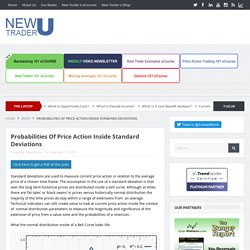
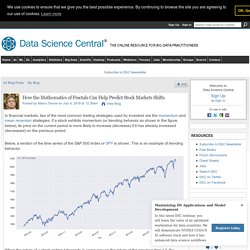
The assumption in the use of a standard deviation is that over the long term historical prices are distributed inside a bell curve. Although at times there are ‘fat tales’ or ‘black swans’ in prices versus historically normal distribution the majority of the time prices do stay within a range of extensions from an average. How the Mathematics of Fractals Can Help Predict Stock Markets Shifts. The plot is the following: Log returns for Apple stocks.
The output from the ADF test is: Augmented Dickey-Fuller test statistic: -28.653611206757994p-value: 0.0Critical Values: 1%: -3.4379766581448803 5%: -2.8649066016199836 10%: -2.5685626352082207 In general, we are more likely to reject the null hypothesis, according to which the series is non-stationary (it has a unit root), the “more negative” the ADF test statistic is. The above test corroborates the hypothesis that the log return series is indeed stationary.
The Hurst Exponent There is an alternative way to investigate the presence of mean reversion or trending behavior in a process. Though applications of the Hurst exponent can be found in multiple areas of mathematics, our focus here will be in two of them only, namely fractals and long memory processes. Santiment: Why Bitcoin’s Stock-to-Flow Model Might Work Even Better Than We Thought. For the sake of brevity, this article will skim over the methodology behind Bitcoin’s Stock-to-Flow ratio (SF for short).

For a detailed introduction to the metric, I suggest reading the original Medium article published by PlanB. If you’re interested in up-to-date predictions of Bitcoin’s Stock to Flow model, you can also head over to Digitalics live chart for a real-time overview. Also, if you’re interested in up-to-date Stock to Flow charts for Bitcoin, Ethereum or any ERC-20 coin, you can find them live on Sandata, along with 150 other on-chain and social metrics developed by Santiment, like daily active addresses, on-chain trx volume, exchange flow, whale activity and much more! Instead, this article will add to a specific sub-argument of the Stock-to-Flow framework: namely, that the SF model for gold provides strong validation and statistical support for Bitcoin’s own SF model and its mouth-watering $100k post-halvening prediction. But first, a quick glossary: Simple enough, right? How to Use the Ichimoku Cloud - Technical Analysis Series. The RSI Indicator Explained.
Click here to get a PDF of this post This is a Guest Post by: Colibri Trader @priceinaction.
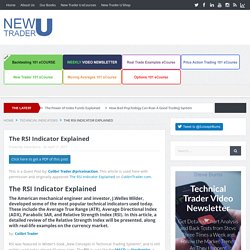
This article is used here with permission and originally appeared The RSI Indicator Explained on ColibriTrader.com. The RSI Indicator Explained The American mechanical engineer and investor, J.Welles Wilder, developed some of the most popular technical indicators used today. These include the Average True Range (ATR), Average Directional Index (ADX), Parabolic SAR, and Relative Strength Index (RSI). By: Colibri Trader RSI was featured in Wilder’s book „New Concepts in Technical Trading Systems“, and is still widely used today almost 40 years later. What does RSI stands for? The relative strength index (RSI) represents the size of recent gains and losses, during a specified time period, and measures the speed of these price movements. A Complete Guide to the MACD Indicator. Click here to get a PDF of this post This is a Guest Post by: Colibri Trader @priceinaction.

This article is used here with permission and originally appeared here on ColibriTrader.com. MACD- How to Use It and More by: Colibri Trader In this article, I will walk you through one of the most popular trading indicators out there- MACD. EXAMPLE 1: Long Trade in DAX EXAMPLE 2: Short Trade in GBPUSD. Trend indicators □ - the sort of thing you will look back on in months/years to come, with your hindsight genius hat on, thinking how obvious it was... (Super Guppy R1.0 by JustUncleL)…