
Update to jQuery Visualize: Accessible Charts with HTML5 from Designing with Progressive Enhancement. Posted by Maggie on 03/12/2010 Topics: accessibility dwpe book jQuery progressive enhancement A while ago, we came up with a technique for creating accessible charts and graphs that uses JavaScript to scrape data from an HTML table and generate bar, line, area, and pie chart visualizations using the HTML5 canvas element.
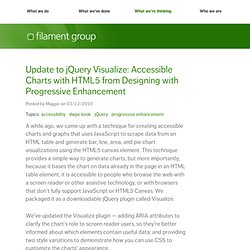
We've updated the Visualize plugin — adding ARIA attributes to clarify the chart's role to screen reader users, so they're better informed about which elements contain useful data; and providing two style variations to demonstrate how you can use CSS to customize the charts' appearance. Visualize is one of the 12 fully-accessible, project-ready, progressive enhancement-driven widgets that accompanies our new book, Designing with Progressive Enhancement.
How the Visualize plugin works The Visualize plugin parses key content elements in a well-structured HTML table, and leverages that native HTML5 canvas drawing ability to transform them into a chart or graph visualization. 20 Fresh JavaScript Data Visualization Libraries. There are plenty of JavaScript libraries out there for rendering your otherwise plain and boring numerical data into beautiful, interactive, and informative visualizations.

The beauty of using JavaScript for data visualization is that, if created correctly, your data will be highly accessible (usually via HTML tables). A long time ago (2008), I wrote about JavaScript solutions for graphing and charting data and this article revisits the topic with twenty more JavaScript libraries that you can use to bring your data to life. 1. Highcharts Highcharts is one of the most promising JavaScript charting libraries to hit the scene recently, with its large array of features including seven charting types (line, pie, and bar among them), the ability to zoom in and out of charts, and tooltips for offering more information about data points. 2. gRaphaël gRaphaël is a charting library based on Raphaël, a vector graphics drawing JavaScript library. 3. 4. jQuery Visualize Plugin 5. moochart 6. 7. dygraphs.
d3.js. Examples of Simile Widgets - SIMILE Widgets. These examples are installed locally (www.simile-widgets.org) and primarily meant to demonstrate the functionality of various simile widgets.
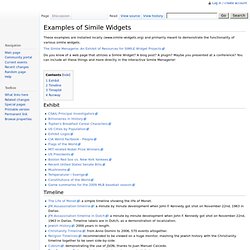
The Simile Menagerie: An Exhibit of Resources for SIMILE Widget Projects Do you know of a web page that utilizes a Simile Widget? A blog post? A plugin? Maybe you presented at a conference? Exhibit Timeline The Life of Monet: a simple timeline showing the life of Monet. Timeplot Runway Anyone? Getting Started with Exhibit - SIMILE Widgets. Ready, Set, Go!
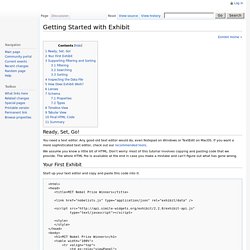
You need a text editor. Any good old text editor would do, even Notepad on Windows or TextEdit on MacOS. If you want a more sophisticated text editor, check out our recommended tools. We assume you know a little bit of HTML. Don't worry: most of this tutorial involves copying and pasting code that we provide. Your First Exhibit Start up your text editor and copy and paste this code into it. <html><head><title>MIT Nobel Prize Winners</title><link href="nobelists.js" type="application/json" rel="exhibit/data" /><script src=" type="text/javascript"></script><style></style></head><body><h1>MIT Nobel Prize Winners</h1><table width="100%"><tr valign="top"><td ex:role="viewPanel"><div ex:role="view"></div></td><td width="25%"> browsing controls here...
Name that file something like nobelists.html. Next, download this data file to the same directory as the HTML file (and make sure it's named nobelists.js). That's it! Supporting Filtering and Sorting Filtering Searching That's it. Types. Exhibit: Data Visualization for Journalists. At NICAR we worked through a hands-on workshop for constructing an Exhibit.
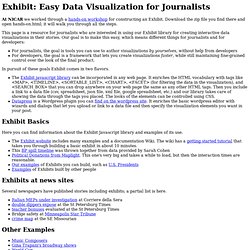
Download the zip file you find there and open hands-on.html; it will walk you through all the steps. This page is a resource for journalists who are interested in using our Exhibit library for creating interactive data visualizations in their stories. Our goal is to make this easy, which means different things for journalists and for developers: For journalists, the goal is tools you can use to author visualizations by yourselves, without help from developers For developers, the goal is a framework that lets you create visualizations faster, while still maintaining fine-grained control over the look of the final product. In pursuit of these goals Exhibit comes in two flavors.
Exhibit Basics Here you can find information about the Exhibit Javascript library and examples of its use. Exhibits at news sites Several newspapers have published stories including exhibits; a partial list is here. Other Examples Datapress. SIMILE Widgets.