
Perceptual mapping. Perceptual Map of Competing Products Cars that are positioned close to each other are seen as similar on the relevant dimensions by the consumer.

For example consumers see Buick, Chrysler, and Oldsmobile as similar. They are close competitors and form a competitive grouping. Factor analysis. Factor analysis is related to principal component analysis (PCA), but the two are not identical.

Latent variable models, including factor analysis, use regression modelling techniques to test hypotheses producing error terms, while PCA is a descriptive statistical technique.[1] There has been significant controversy in the field over the equivalence or otherwise of the two techniques (see exploratory factor analysis versus principal components analysis). [citation needed] Statistical model[edit] Principal component analysis. PCA of a multivariate Gaussian distribution centered at (1,3) with a standard deviation of 3 in roughly the (0.878, 0.478) direction and of 1 in the orthogonal direction.
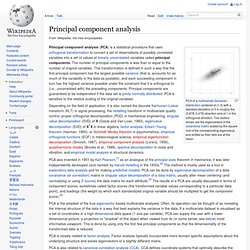
The vectors shown are the eigenvectors of the covariance matrix scaled by the square root of the corresponding eigenvalue, and shifted so their tails are at the mean. Principal component analysis (PCA) is a statistical procedure that uses orthogonal transformation to convert a set of observations of possibly correlated variables into a set of values of linearly uncorrelated variables called principal components. The number of principal components is less than or equal to the number of original variables. PCA is closely related to factor analysis. Marketing factor analysis techniques product positioning.