
Regression with Stata: Lesson 1 - Simple and Multiple Regression. Regression with Stata Chapter 1 - Simple and Multiple Regression Chapter Outline 1.0 Introduction 1.1 A First Regression Analysis 1.2 Examining Data 1.3 Simple linear regression 1.4 Multiple regression 1.5 Transforming variables 1.6 Summary 1.7 Self assessment 1.8 For more information 1.0 Introduction This book is composed of four chapters covering a variety of topics about using Stata for regression.
We should emphasize that this book is about "data analysis" and that it demonstrates how Stata can be used for regression analysis, as opposed to a book that covers the statistical basis of multiple regression. We assume that you have had at least one statistics course covering regression analysis and that you have a regression book that you can use as a reference (see the Regression With Stata page and our Statistics Books for Loan page for recommended regression analysis books). You can access this data file over the web from within Stata with the Stata use command as shown below. Use. Testing the assumptions of linear regression. Quantitative models always rest on assumptions about the way the world works, and regression models are no exception.
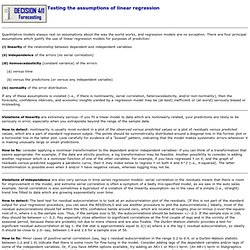
There are four principal assumptions which justify the use of linear regression models for purposes of prediction: (i) linearity of the relationship between dependent and independent variables. Spendingonpublichealth. Investing in Water for a Green Economy: Services, Infrastructure, Policies ... - Google Books. Acemoglu. The End of Poverty: Economic Possibilities for Our Time: Jeffrey D. Sachs, Bono: 9781594200458: Amazon.com. Human Development Index. The HDI was created to emphasize that people and their capabilities should be the ultimate criteria for assessing the development of a country, not economic growth alone.
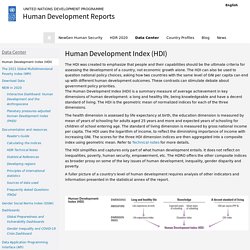
The HDI can also be used to question national policy choices, asking how two countries with the same level of GNI per capita can end up with different human development outcomes. These contrasts can stimulate debate about government policy priorities. The Human Development Index (HDI) is a summary measure of average achievement in key dimensions of human development: a long and healthy life, being knowledgeable and have a decent standard of living. Under-five mortality dashboard. GDP Per Capita and Infant Mortality correlation.
The following chart plots Infant Mortality on the x-axis (number of infant deaths per 1000 live births) against the GDP per capita on the y-axis, for all countries shown in the previous table.
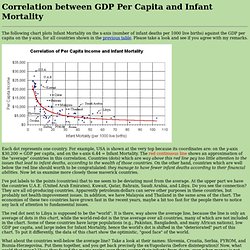
Please take a look and see if you agree with my remarks. Each dot represents one country. For example, USA is shown at the very top because its coordinates are: on the y-axis $30,200 = GDP per capita, and on the x-axis 6.44 = Infant Mortality. The red continuous line shows an approximation of the "average" countries in this correlation. Countries (dots) which are way above this red line pay too little attention to the issues that lead to infant deaths, according to the wealth of those countries.
I've put labels to the points (countries) that to me seem to be deviating most from the average. The red dot next to Libya is supposed to be the "world". Income, inequality, and pollution: a reassessment of the environmental Kuznets Curve. Abstract Improvements in some measures of air and water quality can accompany rising per capita income, as illustrated by the so-called environmental Kuznets curve.
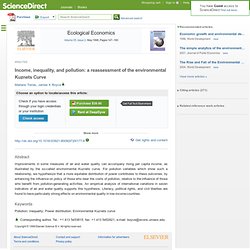
For pollution variables which show such a relationship, we hypothesize that a more equitable distribution of power contributes to these outcomes, by enhancing the influence on policy of those who bear the costs of pollution, relative to the influence of those who benefit from pollution-generating activities. An empirical analysis of international variations in seven indicators of air and water quality supports this hypothesis. Literacy, political rights, and civil liberties are found to have particularly strong effects on environmental quality in low-income countries.
Keywords Pollution; Inequality; Power distribution; Environmental Kuznets curve Copyright © 1998 Elsevier Science B.V. 032_c2. Southern Economic Journal, Vol. 34, No. 4 (Apr., 1968), pp. 477-489. Multicollinearity - Explained Simply (part 1) Human Development Index. In the 2010 Human Development Report a further Inequality-adjusted Human Development Index (IHDI) was introduced.
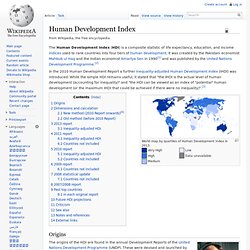
While the simple HDI remains useful, it stated that "the IHDI is the actual level of human development (accounting for inequality)" and "the HDI can be viewed as an index of "potential" human development (or the maximum IHDI that could be achieved if there were no inequality)".[3] World map by quartiles of Human Development Index in 2013. Origins Mahbub-ul-Haq Amartya Sen Dimensions and calculation New method (2010 Report onwards)[6] Published on 4 November 2010 (and updated on 10 June 2011), starting with the 2010 Human Development Report the HDI combines three dimensions: A long and healthy life: Life expectancy at birthEducation index: Mean years of schooling and Expected years of schoolingA decent standard of living: GNI per capita (PPP US$)