
Reordering - Adjacency matrix from edge list (preferrably in Matlab) Common neighbors and preferential attachment score matrixes using igraph for python. Using Netvizz & Gephi to Analyze a Facebook Network. This post was originally featured on published on May 6th, 2010.
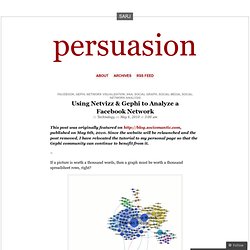
Since the website will be relaunched and the post removed, I have relocated the tutorial to my personal page so that the Gephi community can continue to benefit from it. If a picture is worth a thousand words, then a graph must be worth a thousand spreadsheet rows, right? A Facebook network rendered in Gephi Okay, maybe not, but for practitioners and researchers alike, data visualization can reveal insights that aren’t always obvious from looking at the raw data, no matter how well organized it may be. When we’re talking about social network, data visualization takes the form of a “social graph,” and it can be a powerful tool to discover deeper meanings and applications behind the relationships and communities within a network.
Here you can see some social graphs of the French political blogosphere created by researcher Tim Highfield using an open-source network visualization software called Gephi. Thank you! Copyright (C) 1991, 1999 Free Software Foundation, Inc. 59 Temple Place, Suite 330, Boston, MA 02111-1307 USA Everyone is permitted to copy and distribute verbatim copies of this license document, but changing it is not allowed.

[This is the first released version of the Lesser GPL. It also counts as the successor of the GNU Library Public License, version 2, hence the version number 2.1.] Preamble The licenses for most software are designed to take away your freedom to share and change it. Faster “for” Loops in R. We all know that the apply functions exist to get us away from relying on “for” loops (and “for” loops within “for” loops).
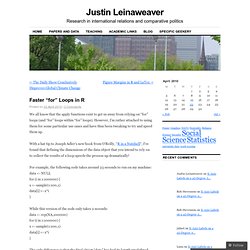
However, I’m rather attached to using them for some particular use cases and have thus been tweaking to try and speed them up. With a hat tip to Joseph Adler’s new book from O’Reilly, “R in a Nutshell“, I’ve found that defining the dimensions of the data object that you intend to rely on to collect the results of a loop speeds the process up dramatically! R - PCA FactoMineR plot data. Cerebral Mastication » Blog Archive » Principal Component Analysis (PCA) vs Ordinary Least Squares (OLS): A Visual Explanation. Over at stats.stackexchange.com recently, a really interesting question was raised about principal component analysis (PCA).
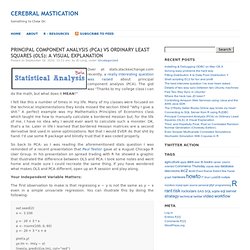
The gist was “Thanks to my college class I can do the math, but what does it MEAN?” I felt like this a number of times in my life. Many of my classes were focused on the technical implementations they kinda missed the section titled “Why I give a shit.” A perfect example was my Mathematics Principles of Economics class which taught me how to manually calculate a bordered Hessian but, for the life of me, I have no idea why I would ever want to calculate such a monster.
Tools for Linking NetLogo and R. BADDELEY, A. and Turner, R. (2011).
Package 'spatstat' Manual. Last accessed March 14th, 2012. An Introduction to R. Table of Contents This is an introduction to R (“GNU S”), a language and environment for statistical computing and graphics.
R is similar to the award-winning1 S system, which was developed at Bell Laboratories by John Chambers et al. It provides a wide variety of statistical and graphical techniques (linear and nonlinear modelling, statistical tests, time series analysis, classification, clustering, ...). This manual provides information on data types, programming elements, statistical modelling and graphics. Node-level Calculations - Daizaburo Shizuka. There are certain pre-packaged commands in statnet and igraph that allows you to calculate various node-level measures.
The statnet package seems to have a more comprehensive list, though igraph has a couple of measures that statnet does not have. The biggest problems (for my purposes) are that igraph does not have a command for calculating information centrality, and neither package seems to have commands for reach or distance-weighted reach. The latter two are pretty straight-forward, so I am posting functions that will let you easily calculate those two measures. Here is a list of commands for node-level calculations included in the two packages. To find out what algorithms they use and how to use the commands, just look at the documentation with the help command for each index (? 5 functions to do Principal Components Analysis in R. Triangle Transitivity in dominance hierarchies & directed graphs - Daizaburo Shizuka. The study of dominance hierarchies dates back to the 1920s, when Schjelderup-Ebbe (1922) first described the emergence of linear dominance hierarchies in flocks of chickens (this is also the origin of the expression 'peck order' or 'pecking order').
Subsequently, mathematicians like Kendall & Babington Smith (1940) and Landau (1951) derived formulas to describe the structures of such hierarchies (for a good overview of these methods, see de Vries (1995--Animal Behaviour) as well as Appleby (1983--Animal Behaviour). The methods by Kendall and Landau, however, were derived in the context of tournaments--a specific type of networks in which all asymmetric dyadic relations (e.g., dominant-subordinate) are known. This contrasts with most data on animal dominance hierarchies. Most of the time, there are pairs that are not observed to interact.
To deal with this problem, various methods have been used to 'fill in' these unknown relations. R & Bioconductor - Manuals. R & Bioconductor Manual R Basics Introduction General Overview R ( is a comprehensive statistical environment and programming language for professional data analysis and graphical display.
The associated Bioconductor project provides many additional R packages for statistical data analysis in different life science areas, such as tools for microarray, next generation sequence and genome analysis. Handling Missing Values. Description A collection and description of functions for handling missing values in 'timeSeries' objects or in objects which can be transformed into a vector or a two dimensional matrix.
The functions are listed by topic. Usage ## S3 method for class 'timeSeries': na.omit(object, method = c("r", "s", "z", "ir", "iz", "ie"), interp = c("before", "linear", "after"), ...) removeNA(x, ...) substituteNA(x, type = c("zeros", "mean", "median"), ...) interpNA(x, method = c("linear", "before", "after"), ...) Arguments Details Missing Values in Price and Index Series: Social networking and recommendation systems. Due: at 11pm on Thursday, July 12. Submit via Catalyst CollectIt (a.k.a. Dropbox). When you sign into Facebook, it suggests friends. In this assignment, you will write a program that reads Facebook data and makes friend recommendations.
This assignment looks longer than it actually is. Social and Economic Networks - Matthew O. Jackson. NodeXL Graph Gallery: Graph Details. Network models. Rtips. Revival 2012! Paul E. Johnson <pauljohn @ ku.edu> The original Rtips started in 1999. It became difficult to update because of limitations in the software with which it was created. How to use hadoop and r for big data parallel processing. How to use hadoop and r for big data parallel processing. Networks -> Centrality -> Influence. Contents - Index PURPOSE Calculate the influence measure between every pair of vertices using the models of Hubbell, Katz or Taylor. DESCRIPTION Successive powers of matrices provide measures of influence since they enumerate the number of possible walks of given length between all pairs of nodes. Since longer walks are assumed to contribute less in terms of influence, an attenuation factor is included and the sum of all walks is taken.
Hubbell includes the identity matrix in the series whereas Katz does not. What is the difference between Unix, Dos and Operating System. The GNU Operating System. CentiBiN - Centralities in Biological Networks - Documentation. How Cells Work" At a microscopic level, we are all composed of cells. Look at yourself in a mirror -- what you see is about 10 trillion cells divided into about 200 different types. Our muscles are made of muscle cells, our livers of liver cells, and there are even very specialized types of cells that make the enamel for our teeth or the clear lenses in our eyes!
If you want to understand how your body works, you need to understand cells. Everything from reproduction to infections to repairing a broken bone happens down at the cellular level. If you want to understand new frontiers like biotechnology and genetic engineering, you need to understand cells as well. Anyone who reads the paper or any of the scientific magazines (Scientific American, Discover, Popular Science) is aware that genes are BIG news these days.
What Are Genes, DNA, and Chromosomes? You’ve heard terms like genes, DNA, the Human Genome Project, and chromosomes. RBGL. What is a Gene? What are Genes? What Is a Gene? What Are Proteins? What Is A Protein? How Much Protein Do I Need? Simple example:How to use foreach and doSNOW packages for parallel computation. Update I checked whether this example was run collectly or not in Windows XP(32bit) only ! In R language, the members at Revolution R provide foreach and doSNOW packages for parallel computation. these packages allow us to compute things in parallel. Plyr - R Grouping functions: sapply vs. lapply vs. apply. vs. tapply vs. by vs. aggregate vs. R - Assigning results of a for loop to an empty matrix. MCL-edge - analysing networks with millions of nodes. R/parallel : An easy-to-use toolkit for Parallel Computing in R.
Research » Matthias Dehmer. Quantitative- and Network Biology. Frank Emmert-Streib. The igraph library for complex network research. #501 (Add subgraph centrality, betweenness, communicability) – NetworkX Developer Zone. Add subgraph centrality, betweenness, communicability Change History Changed 3 years ago by aric. R recipes - igraph. 1. Power-law Distributions. Csgillespie/poweRlaw. Comp 140: lab 05: networkx and the analysis of facebook graphs.
Building and analyzing facebook networks This week we will build and analyze facebook networks for undergraduate students at Rice. LexRank: Graph-based Lexical Centrality as Salience in Text Summarization.