Assessment Resource Banks. Chris Joyce (2008) A Venn diagram is a type of graphic organiser.
Graphic organisers are a way of organising complex relationships visually. They allow abstract ideas to be more visible. Although Venn diagrams are primarily a thinking tool, they can also be used for assessment. However, students must already be familiar with them before they can be used in this way. When to use Venn diagrams are used to compare and contrast groups of things. They are a useful tool for formative assessment because they: can be used to generate discussion; and provide teachers with information about students’ thinking. In science, they are helpful for classification. As an accepted convention for representing similarities and differences, knowing how to use them contributes to the Key Competency, Using language, symbols, and texts. The theory Venn diagrams originate from a branch of mathematics called set theory. Information is usually presented to students in linear text. How the strategy works. Graphing Calculator.
Create a Pie Chart, Free . Customize, download and easily share. Just enter the amounts, pick some colors/fonts, and we'll take it from there! Create a Graph Classic - Bar Graph - NCES Kids' Zone. There are all kinds of charts and graphs, some are easy to understand while others can be pretty tricky.
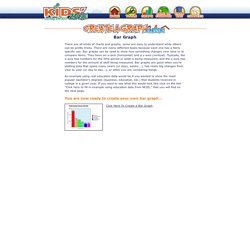
There are many different types because each one has a fairly specific use. Bar graphs can be used to show how something changes over time or to compare items. They have an x-axis (horizontal) and a y-axis (vertical). Typically, the x-axis has numbers for the time period or what is being measured, and the y-axis has numbers for the amount of stuff being measured. Bar graphs are good when you're plotting data that spans many years (or days, weeks...), has really big changes from year to year (or day to day...), or when you are comparing things. An example using real education data would be if you wanted to show the most popular bachelor's degrees (business, education, etc.) that students received in college in a given year. Multiplication - Times Tables. The 12 Times Table Print one and put it on your wall, or paste it in an exercise book.
How to Learn Your life will be a lot easier when you can simply remember the multiplication tables. So ... train your memory! First, use the table above to start putting the answers into your memory. Then use the Math Trainer - Multiplication to train your memory, it is specially designed to help you memorize the tables. Use it a few times a day for about 5 minutes each, and you will learn your tables. Try it now, and then come back and read some more ... So, the two main ways for you to learn the multiplication table are: Reading over the table Exercising using the Math Trainer But here are some "tips" to help you even more: Tip 1: Order Does Not Matter Example: 3×5=15, and 5×3=15 Another Example: 2×9=18, and 9×2=18 In fact half of the table is a mirror image of the other!
So, don't memorize both "3×5" and "5×3", just memorize that "a 3 and a 5 make 15" when multiplied. This is very important! Some Patterns More Help. Fractions. How many parts of a whole Slice a pizza, and we get fractions: The top number says how many slices we have.
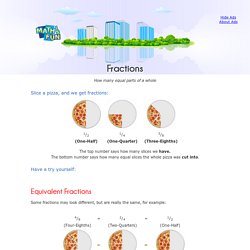
The bottom number says how many equal slices the whole pizza was cut into. Have a try yourself: Click the pizza → "One Eighth" © 2018 MathsIsFun.com v0.852 Equivalent Fractions Some fractions may look different, but are really the same, for example: It is usually best to show an answer using the simplest fraction ( 1/2 in this case ). Numerator / Denominator We call the top number the Numerator, it is the number of parts we have. NumeratorDenominator You just have to remember those names! Adding Fractions It is easy to add fractions with the same denominator (same bottom number): One-quarter plus one-quarter equals two-quarters, equals one-half Another example: Five-eighths plus one-eighth equals six-eighths, equals three-quarters Adding Fractions with Different Denominators But what about when the denominators (the bottom numbers) are not the same?
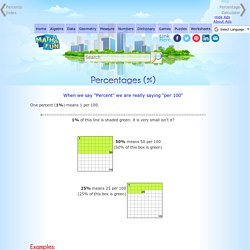
Introduction to Percentages. When we say "Percent" we are really saying "per 100" One percent (1%) means 1 per 100. 1% of this line is shaded green: it is very small isn't it?