
Training courses for Excel 2010.
UAS MAPPING 2014 RENO. What is ASPRS?
Founded in 1934, the American Society for Photogrammetry and Remote Sensing (ASPRS) is a scientific association serving over 7,000 professional members around the world. Our mission is to advance knowledge and improve understanding of mapping sciences to promote the responsible applications of photogrammetry, remote sensing, geographic information systems (GIS), and supporting technologies. The role of ASPRS in UAS technologies: ASPRS: The Imaging and Geospatial Information Society The American Society for Photogrammetry and Remote Sensing (ASPRS) has officially incorporated the tag line “The Imaging and Geospatial Information Society,” as part of the ASPRS identity. In announcing this action, ASPRS President Tom Lillesand pointed out that, “Our Board of Directors took unanimous action to adopt a tag line on March 31, 1998 at the Society’s annual meeting.
Choosing the Correct Statistical Test in SAS. What statistical analysis should I use?
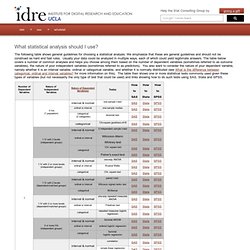
The following table shows general guidelines for choosing a statistical analysis. We emphasize that these are general guidelines and should not be construed as hard and fast rules. Usually your data could be analyzed in multiple ways, each of which could yield legitimate answers. The table below covers a number of common analyses and helps you choose among them based on the number of dependent variables (sometimes referred to as outcome variables), the nature of your independent variables (sometimes referred to as predictors).
You also want to consider the nature of your dependent variable, namely whether it is an interval variable, ordinal or categorical variable, and whether it is normally distributed (see What is the difference between categorical, ordinal and interval variables? This page was adapted from Choosing the Correct Statistic developed by James D.
How to Calculate Effect Size Statistics. There are many effect size statistics for ANOVA and regression, and as you may have noticed, journal editors are now requiring you include one.
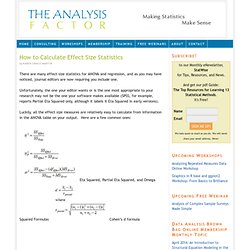
Unfortunately, the one your editor wants or is the one most appropriate to your research may not be the one your software makes available (SPSS, for example, reports Partial Eta Squared only, although it labels it Eta Squared in early versions). Luckily, all the effect size measures are relatively easy to calculate from information in the ANOVA table on your output. Here are a few common ones: Eta Squared, Partial Eta Squared, and Omega Squared Formulas Cohen’s d formula You have to be careful, if you’re using SPSS, to use the correct values, as SPSS labels aren’t always what we think. What SPSS labels SS Total actually also includes SS for the Intercept, which is redundant to other information in the model.
The denominator for Cohen’s d is always some measure of standard deviation. Measurement Validity Types. « PreviousHomeNext » There's an awful lot of confusion in the methodological literature that stems from the wide variety of labels that are used to describe the validity of measures.
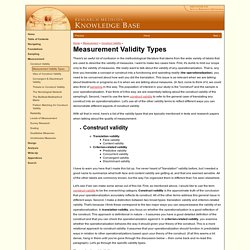
I want to make two cases here. First, it's dumb to limit our scope only to the validity of measures. We really want to talk about the validity of any operationalization. That is, any time you translate a concept or construct into a functioning and operating reality (the operationalization), you need to be concerned about how well you did the translation. With all that in mind, here's a list of the validity types that are typically mentioned in texts and research papers when talking about the quality of measurement: Construct validity Translation validity Face validity Content validity Criterion-related validity Predictive validity Concurrent validity Convergent validity Discriminant validity I have to warn you here that I made this list up. Let's see if we can make some sense out of this list. Effect Sizes, FTW! Today I give my favourite lecture of the year.

Second year students today will be introduced to some of the controversies surrounding the use of p-values. Although I don’t go into great depth, I highlight that p-values—among the many problems associated with them—don’t provide answers to the type of questions we—as researchers—are asking. You might think this is heresy, but if you take a few minutes to mull this over, you will realise it is right.
Remember, the p-value gives us the probability of observing scores as extreme (or more so) as we have, assuming the null is true. The Analysis Factor — Statistical Consulting, Resources, and Statistics Workshops for Researchers in Psychology, Sociology, and other Social and Biological Sciences. Resource Center - National Council on Measurement in Education. NCME seeks to provide services to a wide variety of audiences.
The Resource Center provides information that may be of interest to our membership (e.g., measurement practitioners, researchers, and graduate students) as well as to additional groups (e.g., parents, students, and test takers). Resources have been categorized so they can be either searched by audience or by topic. Use the links in the Resources by Audience section to find resources that may be of interest to each type of audience.
If you would like to search by topic, use the drop-down menu under the Resource Search heading to find documents on a specific topic. NCME Items articles are among the listings returned by using the search options on this page. A searchable glossary of important terms in assessment and measurement has been prepared by David Frisbie and a group of advisors. University of Nebraska–Lincoln.
Advanced Search: EBSCOhost.