
Untitled. School_Safety_Infographic.jpg (JPEG Image, 993 × 6621 pixels) - Scaled (15%) Plagiarism-statistics.jpg (JPEG Image, 800 × 3402 pixels) - Scaled (29%) Infographic_Cognitive_Biases.jpg (JPEG Image, 721 × 885 pixels)
Details-about-us-university-students_544e1fe1cd558_w1500.jpg (JPEG Image, 1500 × 2328 pixels) - Scaled (43%) Meditation-science-and-the-effects-on-you_5419b2280fd62_w1500.jpg (JPEG Image, 1500 × 3603 pixels) - Scaled (27%) The-next-generation-of-education-system_541c3e3bbf60e_w1500.jpg (JPEG Image, 1500 × 6524 pixels) - Scaled (15%) The-hidden-half-school-employees-who-dont-teach_53eb997fcc449_w1500.png (JPEG Image, 1500 × 5358 pixels) - Scaled (18%) Facts-about-education_53eb794cd8d6c_w1500.jpg (JPEG Image, 1500 × 1519 pixels) - Scaled (65%) Education Compared. To embed this infographic on your site, copy this code: <iframe title="Education Compared" width="650" height="489" src=" frameborder="0"></iframe><br /><a href=" By Top Education Degrees</a> It has been said that education is the bedrock of society.

In this graphic, we take a look at education levels in each state to see just how education effects the states in areas of social and economic importance. Among states with the highest levels of median household income (those on the map in shades of green), college graduation ranking ranged from 1st in the country (District of Columbia) to 24th in the country (Alaska), with the seven remaining states in those income ranges appearing in the top ten for college graduation rate. Interestingly, these same states show high levels of credit debt compared with other states, with all of them placing among the 15 states with the highest levels of credit debt. High school graduation rates and median household income seem to be less strongly correlated.
Why-handwriting-helps-you-learn.jpg (JPEG Image, 720 × 5700 pixels) - Scaled (17%) Common_Core.jpg (JPEG Image, 900 × 5207 pixels) - Scaled (19%) Copyright-Flowchart.jpg (JPEG Image, 800 × 4098 pixels) Learning-pyramid_539093d579101_w1500.jpg (JPEG Image, 1500 × 1125 pixels) - Scaled (57%) Did I Plagiarize? The Types and Severity of Plagiarism Violations. Plagiarism is a hot topic in the academic world, but it applies in all aspects of our lives.
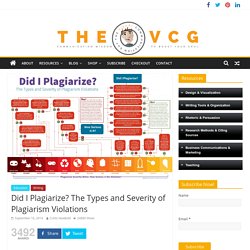
In a country and culture that values intellectual property, it is imperative that we are conscious of plagiarism guidelines and standards. The reality is, in many facets of life, when we make mistakes, we can claim ignorance. But when it comes to plagiarizing, there is little slack given; we are all expected to understand plagiarism guidelines and what constitutes a violation. While plagiarism is never considered acceptable, there are varying levels of severity with different types of plagiarism violations. So are you wondering if you’ve plagiarized?
For a similar chart on the copyright usage of images, see the “Can I Use That Picture” graphic. This Infographic has also been translated into Spanish, Chinese, and Indonesian. To purchase a 20×30 printed poster, please visit the online store. Related Articles The Thirteen Types of Plagiarism Why We Should Be Teaching Visual Literacy in High School.
Star-bright-montessori.jpg (JPEG Image, 900 × 3501 pixels) - Scaled (19%) How-will-we-rebuild-americas-school-buildings_530cb28e83b0b_w1500.jpg (JPEG Image, 1500 × 6102 pixels) - Scaled (10. Teaching With Infographics. Pages Thursday, February 6, 2014 Teaching With Infographics If you are new to this blog, you might not have taken a look at all the tabs located at the top of the page.

Under "Infographics" you will find resources from creation to examples by subject area. This past week I taught a few classes on infographics and decided to update the page by adding a section called "Teaching With Infographics". Facebook Twitter Google+ Pinterest Share ShareThisFacebookTweetLinkedInPinterestEmail Posted by Julie Greller at 8:41 AM Labels: create infographics, infographics, Piktochart, teaching with infographics No comments: Information-destruction-through-history-infographic-final-revised.png (PNG Image, 2100 × 2100 pixels)
ECE. Ed Tech. Global. High School. Special Education. STEM. Student Life. Teaching. University. How-to-give-a-constructive-criticism-sandwich_51652570c6010.jpg (JPEG Image, 640 × 2718 pixels) What-will-it-take-to-achieve-learning-for-all_516d673c37f34.png (PNG Image, 960 × 2595 pixels) How-would-the-world-change-if-every-girl-was-educated_506b231d7fd13.jpeg (JPEG Image, 1000 × 1560 pixels) - Scaled (44. Mind the Gap. Education-in-the-uae_517b374798324.jpg (JPEG Image, 1024 × 570 pixels) Infographic: Meditation in Schools Across America. Cheaters-kindergarten-to-high-school-college-to-working-world_5136e4d55b51f.jpg (JPEG Image, 800 × 8528 pixels) How-has-the-internet-changed-education-Infographic.png (800×2802) BetterEducationHealthierLives-NPHSeries-FINAL.jpg (498×6040)
Where-are-we-now-looking-at-a-nation-at-risk-30-years-later_5176b9c59fe7c.jpg (JPEG Image, 600 × 4950 pixels) Women-and-men-in-uzbekistan-difference-in-education_5177cd113b4ab.jpg (JPEG Image, 1024 × 3102 pixels) EducationChanging_Final.jpg (JPEG Image, 800 × 2820 pixels) A-spotlight-on-technology_503bb0372efdb.jpg (2604×1736) Getting-the-facts-on-game-based-learning_5193a4db561fd. Americas-schools-1950s-vs-today_503d0d38c14f9.png (1000×2086) The-stem-dilemma_517703828bd55.jpg (JPEG Image, 750 × 4522 pixels)