
Imagining the Tenth Dimension. Xd3d. Xd3d is a simple scientific visualization tool designed to be easy to learn.
It can plot 2d and 3d meshes, with shadowing, contour plots, vector fields, iso-contour (3d), as well as 3d surfaces z=f(x,y) defined by an algebraic expression or a cloud of points. It generates high quality vector PostScript files for scientific publications and still or animated bitmap images. It includes the graph plotter xgraphic. xd3d can be installed on any unix system using X windows: all the unix workstations, linux systems, Mac OS X, and Microsoft-Windows computers with an X11 emulation like the free software Cygwin/Xfree. The MayaVi Data Visualizer.
Bathsheba Grossman Sculpting Geometry. The Scientific Graphics Project. Maths posters in the London Underground. Paul Bourke. C++ Boids. Early Results Unfortunately, I didn't have a lot of time to work on the boids because it was a side project; my primary responsibilities at the time were working on Graphics Service (the graphics library used in the airport simulation and the flight simulator) and the autopilot software.
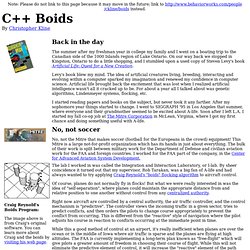
However, I did manage to get a simple boids implementation together. Though it used plane models in the animation, these boids behaved nothing like real planes. I think the best word to describe their behavior would be "cute"; they behaved a lot like fish in a tank. Towards the end of my first work term at Mitre a co-worker, Dr. Boids. In 1986 I made a computer model of coordinated animal motion such as bird flocks and fish schools.
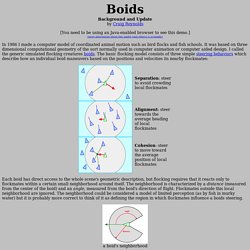
It was based on three dimensional computational geometry of the sort normally used in computer animation or computer aided design. I called the generic simulated flocking creatures boids. News. Web Resources. Visual Math. "Architecture, Patterns, and Mathematics", by Nikos A.