
Hans Rosling: the man who's making data cool. He's been called the Jedi master of data visualisation, dubbed a statistics guru and introduced as the man in whose hands data sings.
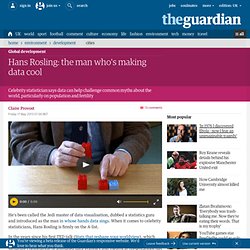
When it comes to celebrity statisticians, Hans Rosling is firmly on the A-list. In the years since his first TED talk (Stats that reshape your worldview), which thrust him into the spotlight in 2006 with millions of online views, Rosling's now signature combination of animated data graphics and theatrical presentations has featured in dozens of video clips, a BBC4 documentary on The Joy of Stats, and numerous international conferences and UN meetings. Instead of static bar charts and histograms, Rosling, professor of global health at Sweden's Karolinska Institute, has used a combination of toy bricks, cardboard boxes, teacups and vibrant, animated data visualisations to breathe life into statistics on health, wealth and population. With comic timing and a flair for the unusual, Rosling's style has undoubtedly helped make data cool.
"I can show you! International Professors Project Group News. How long does it take for an idea to turn into a movement for change?
And how long before that movement achieves its goals? Today, the tenth anniversary of the Budapest Open Access Initiative, seems like a good time to ask these questions. The term “Open Access” (OA), the free online availability of research literature, was first coined at an Open Society sponsored meeting in Budapest in December 2001.
The Information Program had supported the distribution of hard copies of scientific journals to universities in Central and Eastern Europe and the former Soviet Union, and was interested in harnessing the power of the internet to more easily put academic research in the hands of those who could benefit. So we brought together leaders who were exploring alternative publishing models. Open Data - Einführung.