
30 Simple Tools For Data Visualization. There have never been more technologies available to collect, examine, and render data.
Here are 30 different notable pieces of data visualization software good for any designer's repertoire. They're not just powerful; they're easy to use. In fact, most of these tools feature simple, point-and-click interfaces, and don’t require that you possess any particular coding knowledge or invest in any significant training. Let the software do the hard work for you. Your client will never know. 1. iCharts 2. FusionCharts Suite XT is a professional and premium JavaScript chart library that enables us to create any type of chart. 3. Modest Maps is a small, extensible, and free library for designers and developers who want to use interactive maps in their own projects. 4.
Pizza Pie Charts is a responsive pie chart based on the Snap SVG framework from Adobe. A Periodic Table of Visualization Methods. Great tools for data visualization. Most data is meaningless to most people — unless it is visualized.
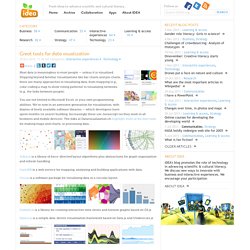
Stepping beyond familiar visualizations like bar charts and pie charts, there are many approaches to visualizing data, from mapping (e.g., color coding a map to show voting patterns) to visualizing networks (e.g., the links between people). You are not limited to Microsoft Excel, or your own programming abilities. We’re now in an awesome generation for visualization, with dozens of freely available software libraries — which developers have spent months (or years!) Building. Increasingly these use Javascript (so they work in all browsers and mobile devices). Arbor.js is a library of force-directed layout algorithms plus abstractions for graph organization and refresh handling. CartoDB is a web service for mapping, analyzing and building applications with data. Circos is a software package for visualizing data in a circular layout. Cubism.js is a library for creating interactive time series and horizon graphs based on D3.js.
Infographs. The 36 best tools for data visualization. It's often said that data is the new world currency, and the web is the exchange bureau through which it's traded.
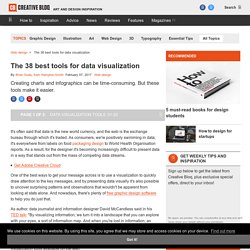
As consumers, we're positively swimming in data; it's everywhere from labels on food packaging design to World Health Organisation reports. As a result, for the designer it's becoming increasingly difficult to present data in a way that stands out from the mass of competing data streams. Get Adobe Creative Cloud One of the best ways to get your message across is to use a visualization to quickly draw attention to the key messages, and by presenting data visually it's also possible to uncover surprising patterns and observations that wouldn't be apparent from looking at stats alone.
And nowadays, there's plenty of free graphic design software to help you do just that. As author, data journalist and information designer David McCandless said in his TED talk: "By visualizing information, we turn it into a landscape that you can explore with your eyes, a sort of information map. The 5 Resources Framework - The 5 Resources Model of Critical Digital Literacy. Visual information resources. Visualising Data » Blog Archive » Essential Resources: Multivariate, network and qualitative visualisations.
This is part of a series of posts to share with readers a useful collection of some of the most important, effective and practical data visualisation resources.
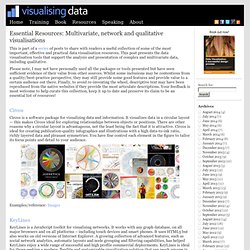
This post presents the data visualisation tools that support the analysis and presentation of complex and multivariate data, including qualitative. Please note, I may not have personally used all the packages or tools presented but have seen sufficient evidence of their value from other sources. Whilst some inclusions may be contentious from a quality/best-practice perspective, they may still provide some good features and provide value to a certain audience out there.
Finally, to avoid re-inventing the wheel, descriptive text may have been reproduced from the native websites if they provide the most articulate descriptions. Your feedback is most welcome to help curate this collection, keep it up to date and preserve its claim to be an essential list of resources! Circos Examples/reference: Images KeyLines Sentinel Visualizer NodeXL.
Visualising data – a catalogue of resources « iapresentation.