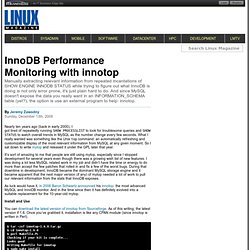

InnoDB Performance Monitoring with innotop. Manually extracting relevant information from repeated incantations of SHOW ENGINE INNODB STATUS while trying to figure out what InnoDB is doing is not only error prone, it's just plain hard to do.

And since MySQL doesn't expose the data you really want in an INFORMATION_SCHEMA table (yet?) , the option is use an external program to help: innotop. Nearly ten years ago (back in early 2000), I got tired of repeatedly running SHOW PROCESSLIST to look for troublesome queries and SHOW STATUS to watch overall trends in MySQL as the number change every few seconds. The innotop MySQL and InnoDB monitor at Xaprb. MySQL and InnoDB expose lots of information about their internals, but it’s hard to gather it all into one place and make sense of it.

I’ve written a tool to do that, and you are free to download and use it. This article introduces innotop, a powerful text-mode MySQL and InnoDB monitoring tool. It has lots of features, is fast and configurable, and it’s easy to use. Note: I’m now making it a priority to make innotop very stable and robust. Sundry MySQL Scripts and Docs.