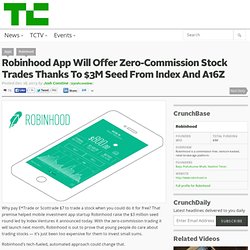

Robinhood App Will Offer Zero-Commission Stock Trades Thanks To $3M Seed From Index And A16Z. Why pay E*Trade or Scottrade $7 to trade a stock when you could do it for free?

That premise helped mobile investment app startup Robinhood raise the $3 million seed round led by Index Ventures it announced today. With the zero-commission trading it will launch next month, Robinhood is out to prove that young people do care about trading stocks — it’s just been too expensive for them to invest small sums. Robinhood’s tech-fueled, automated approach could change that. Wait. Is zero-commission trading even possible? Robinhood first launched in April as an iOS app for tracking stocks and sharing predictions of whether they’d rise or fall. At the time, the Robinhood app was designed to fill a major hole on mobile, where there was no decent native equivalent of Yahoo Finance or Google Finance’s popular websites.
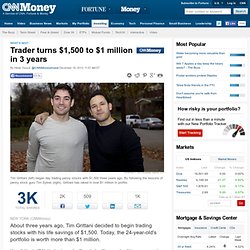
In October after eight months of waiting, Robinhood was approved by finance regulatory agency FINRA to become a broker-dealer. Penny stock trader: From $1,500 to $1 million in three years. Tim Grittani (left) began day trading penny stocks with $1,500 three years ago.

By following the lessons of penny stock guru Tim Sykes (right), Grittani has raked in over $1 million in profits. NEW YORK (CNNMoney) How did he do it? Not by buying and selling stocks of large and well-known companies like Apple (AAPL, Fortune 500) or Ford (F, Fortune 500). Instead, Grittani trades penny stocks -- very small companies that typically have a price below $1. He's the first to admit that it's a risky strategy. "I've been trading every single day for almost three years, and it's been a slow, day-to-day process," Grittani said.
So why trade penny stocks? Plus, penny stocks are notorious for being part of so-called pump-and-dump schemes, in which scammers buy up shares and then promote it as the next hot stock on blogs, message boards, and e-mails. Related: 5 most common financial scams. Finding the Best Stocks to Buy Using Google's Free Screening Tool. Google’s free stock screening tool can be used to find great stocks. No website can tell you the best stocks to buy right now, but you can learn how to discover gems for yourself.
Without the right tools, you would have to research company after company to find the best stocks to buy. That would be a lot of work! Luckily, you have Google’s Stock Screening Tool and these instructions on how to use it strategically. A word of caution: the vast majority of investors will not be able to outperform the market over time. Step 1: Determine the Type of Stock You’re Looking For For instructional purposes, we will use a formula that works well for us as value investors. As value investors, we love it when stocks lose value for irrational reasons. “Be fearful when others are greedy and greedy when others are fearful” – Warren Buffett The paragraph describing the type of company we’re looking for reads something like this:
New Tab. This Man Will Make You Rich. 5 Great Stock Chart Patterns Every Investor Should Know. Over a series of articles, I have reviewed the basics of technical analysis.

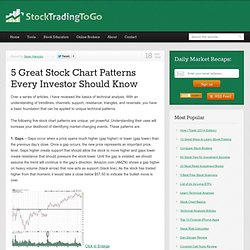
With an understanding of trendlines, channels, support, resistance, triangles, and reversals, you have a basic foundation that can be applied to unique technical patterns. The following five stock chart patterns are unique, yet powerful. Understanding their uses will increase your likelihood of identifying market-changing events. These patterns are: 1. Click to Enlarge 2. To see this pattern in action, consider the Volatility index (VIX). 3. 4. Click to Enlarge 5. While one list cannot capture every possible chart pattern, these five will allow you to develop a base of knowledge that leads to increased trading success. Sean Hannon, CFA, CFP is a professional fund manager.
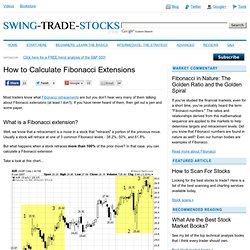
How to Read Stock Charts: Explore my 156 page interactive course, The Interactive Guide to Technical Analysis. Further Education, Technical Analysis: 7 things to look at when assessing a stock. How to Pick Stocks like Warren Buffett. Fibonacci Extensions. Most traders know what Fibonacci retracements are but you don't hear very many of them talking about Fibonacci extensions (at least I don't).

If you have never heard of them, then get out a pen and some paper. What is a Fibonacci extension? Well, we know that a retracement is a move in a stock that "retraces" a portion of the previous move. Usually a stock will retrace at one of 3 common Fibonacci levels - 38.2%, 50%, and 61.8%. But what happens when a stock retraces more than 100% of the prior move? Take a look at this chart... In the first example, AIR pulls back from $25.92 (1) to $23.11 (2). Could we have known that this stock might run into resistance at $26.68 (3)? Take the difference in price between 1 and 2. In the second example... PUMPs & dumpS. 5 Stocks Hedge Funds Love.