
The Only Chart You Need To Mix A Proper Cocktail. We’d been trying to complete a chart of cocktails for over a year.
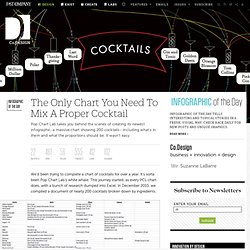
It’s sorta been Pop Chart Lab’s white whale. This journey started, as every PCL chart does, with a bunch of research dumped into Excel. In December 2010, we compiled a document of nearly 200 cocktails broken down by ingredients. Then we moved into OmniGraffle. In our first attempt, we grouped the spirits, wines, liqueurs, cordials, etc., and then started drawing lines connecting each ingredient to the appropriate cocktail. We could tell right away this likely wasn’t going to work. Convinced this wasn’t going to work, we put the idea on the shelf for a few months. Our breakthrough here was putting the chocolates in the center, the candy bars in a ring around the outside, and then the other ingredients at the top and bottom. The Only Chart You Need To Mix A Proper Cocktail.
§ Section Design - Part 2. A contribution to MAS Context – a themed quarterly journal created by MAS Studio in Chicago.
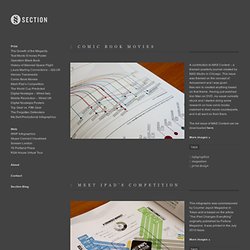
This issue was themed on the concept of Amusement and I was given free-rein to created anything based on that theme. Having just watched Iron Man on DVD, my usual curiosity struck and I started doing some research on how comic books matched to their movie counterparts, and it all went on from there. The full issue of MAS Context can be downloaded here.
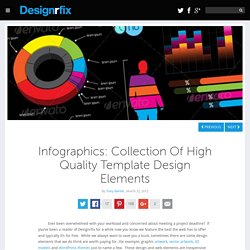
More images » This infographic was commissioned by Courrier Japon Magazine in Tokyo and is based on the article “The iPad Changes Everything” originally published by Fortune Magazine. More images » This infographic plots the forthcoming World Cup as predicted by a formula based on the GDP of each country. This was published in Wired UK, June 2010 issue. More images » A new edition of my Digital Nostalgia work commissioned for Wired Italy. This was published in Wired Italy, March 2010 issue. More images » How To Create Outstanding Modern Infographics. In this tutorial you will learn that data doesn't have to be boring, it can be beautiful!

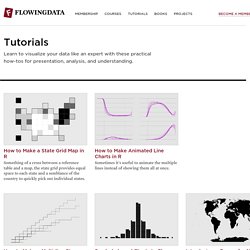
Learn how to use various graph tools, illustration techniques and typography to make an accurate and inspiring infographic in Adobe Illustrator. Start by using the Rectangle Tool (M) to draw a shape. Give it a subtle radial gradient too. The entire design is based on a grid of four columns. To make the columns first select the rectangle and drag a guide onto the centre of the shape.
Condense the shape so it fits within the left-most guide and centre guide. Move the shape over to the right and add another guide to the centre here. Using the Rectangle Tool (M) draw a thin white box on the centre line that will be the width of the gap between the columns. Repeat the process for the other columns with your final result being below.
Infographics: Collection Of High Quality Template Design Elements. Ever been overwhelmed with your workload and concerned about meeting a project deadline?
If you’ve been a reader of Designrfix for a while now you know we feature the best the web has to offer and typically it’s for free. While we always want to save you a buck, sometimes there are some design elements that we do think are worth paying for…for example; graphic artwork, vector artwork, 3D models and WordPress themes just to name a few. These design and web elements are inexpensive and customizable. Using a pre-formatted template for your work can cut your workload in half and help you meet your next clients deadline. In this weekly series of posts we will feature these various graphic and design elements to help you succeed in lightening your workload and delivering to your client. I am confident that you will find one of these Infographic Templates & Design elements to fit your every design needs and budget costs. Want more on Premium Products? Party Flyers: 40+ Awesome Template Designs.
Tutorials. How to Make a State Grid Map in R Something of a cross between a reference table and a map, the state grid provides equal space to each state and a semblance of the country to quickly pick out individual states.
How to Make Animated Line Charts in R Sometimes it's useful to animate the multiple lines instead of showing them all at once. How to Make a Multi-line Step Chart in R For the times your data represents immediate changes in value. Symbols-based Charts to Show Counts in R Add visual weight by using individual items to show counts. Introducing a Course for Mapping in R Mapping geographic data in R can be tricky, because there are so many ways to complete separate tasks. Data Visualization and Infographics Resources.
Advertisement Data visualizations and infographics can make complex datasets easier to understand and comprehend.
By creating a graphical represenatation of data and statistics, complicated concepts and information can make more sense in less time. Many visualizations focus on representing a specific set of data or statistical information. Others focus on less-concrete topics, providing a visual representation of abstract concepts. Generally speaking, the first type appear more like graphs or charts and the latter are often more creative and imaginative. But visualizations and infographics can be used poorly, too. Also consider our previous articles: