
Statlab - An Interactive Learning Environment for Design of Experiments written in Java - Manual for Teachers. In order to get acquainted to Statlab, a manual for students has been written.
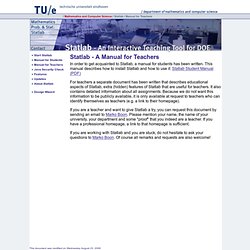
This manual describes how to install Statlab and how to use it: Statlab Student Manual (PDF) For teachers a separate document has been written that describes educational aspects of Statlab, extra (hidden) features of Statlab that are useful for teachers. It also contains detailed information about all assignments. Because we do not want this information to be publicly available, it is only available at request to teachers who can identify themselves as teachers (e.g. a link to their homepage).
If you are a teacher and want to give Statlab a try, you can request this document by sending an email to Marko Boon. If you are working with Statlab and you are stuck, do not hesitate to ask your questions to Marko Boon. Heinrich-Heine-Universität - Institut für experimentelle Psychologie. G*Power is a tool to compute statistical power analyses for many different t tests, F tests, χ2 tests, z tests and some exact tests.
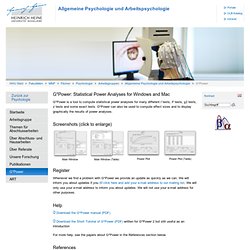
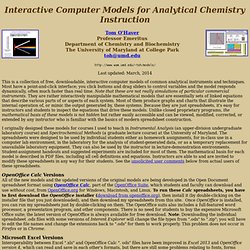
G*Power can also be used to compute effect sizes and to display graphically the results of power analyses. Whenever we find a problem with G*Power we provide an update as quickly as we can. We will inform you about updates if you click here and add your e-mail address to our mailing list. We will only use your e-mail address to inform you about updates. Interactive models for Analytical Chemistry Instruction.
Tom O'Haver Professor Emeritus Department of Chemistry and Biochemistry The University of Maryland at College Park toh@umd.edu Last updated: March, 2014 This is a collection of free, downloadable, interactive computer models of common analytical instruments and techniques.
Russ Lenth's power and sample-size page. Note: These require a web browser capable of running Java applets (version 1.3 or higher).
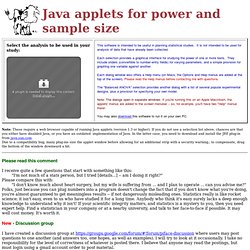
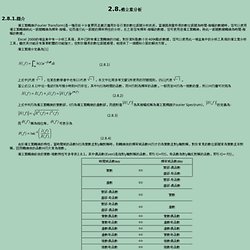
If you do not see a selection list above, chances are that you either have disabled Java, or you have an outdated implementation of Java. In the latter case, you need to download and install the JRE plug-in from java.sun.com. Due to a compatibility bug, many plug-ins size the applet window before allowing for an additional strip with a security warning.; to compensate, drag the bottom of the window downward a bit. 傅立葉分析. 2.8.傅立葉分析 2.8.1.簡介.
Alpha? Take the Tour: What Is Wolfram. iThome online : : 技術專題. 數學軟體. Tutorials / Documentation / support & services / Home. Download / Scilab / products / Home. New functionalities in Scilab 5.3.1 Embedded Help. Downloads. Suggestions and comments about obscure and useful software. 研究與教學. 非會員品管知識. Analytica - Risk & Decision Analysis Software - Created by Lumina.
鼎茂統計諮詢中心. Excel 中 Analysis ToolPak ANOVA 工具的數值改良說明. 本文將分別告訴您三種 Analysis ToolPak ANOVA 工具中的數值改良,並說明在極端的情況中,Microsoft Excel 2002 (含) 以前版本中的不正確結果。

許多函數都需要計算平均數的差平方和。 為了精確執行這項操作,Microsoft OfficeExcel 2003 (含) 以後版本 會使用二段式程序,在第一階段找出平均數,然後在第二階段計算平均數的差平方。 就精確的算術而言,在使用「計算機公式」的舊版 Excel 中會發生相同的結果。 這個公式的名稱來自於以前統計學家大多使用計算機而非電腦。 舊版會使用計算機公式來加總觀察值的平方,然後從此總和中減去下列的數量: ((sum of observations)^2) / number of observations 這項計算會在一段式資料處理中進行。 就有限精確度算術而言,計算機公式很容易在極端的情況中發生無條件捨去的錯誤。 統計計算方面的專家並不建議使用計算機公式。 Excel 2003 (含) 以後版本 對於三種 ATP ANOVA 模型都是使用二段式程序。 單因子有複寫的雙因子沒有複寫的雙因子本文稍後將會說明這些模型。 由於 Excel 對於 DEVSQ 一定是使用兩段式程序,因此本文經常會以它來說明改良後的程序。 對於每一項 ANOVA 工具,ATP 輸出都包含一份「摘要」表格,其中包含「計數」、「總和」、「平均」和「變異數」的值,以及具有 SS、df、MS、F 和 P 值的平方與值的各種不同總和的 ANOVA 表格。 Calculator for Bending Moment and Shear Force. Bending moment calculator metric. Software Downloads. Activating Anova DB Analysis Function - Excel 2007. Lean Six Sigma Toolbox. Taguchi Method : Excel Spreadsheets by P. R. Apte. Define Phase Lean Six Sigma Template.
About Steven Bonacorsi, Vice President (20+ years experience) Expertise: Certified Lean Six Sigma Master Black Belt (MBB), Certified Project Management Professional (PMP), Masters in Computer Information Systems (MS-CIS) and Business Administration (MBA), GE Crotonville Leadership Program (PM), and GE Certified Workout and Change Acceleration Process Instructor (CAP) Summary: Experienced Engagement Director/Principal with 16 years of process improvement experience in the areas of information technology, human resources, federal defense, asset management, finance, retail, and medical services industries.
Global experience in leading enterprise-wide deployments both Federal and Commercial. Proven skills in business development, deployment design, Lean Six Sigma implementation, curriculum and tool development, financial/operational due diligence, balanced scorecards, and new product and process designs. Untitled. Statistical Software and the e-Handbook of Statistical Methods. What is Six Sigma Quality Function Deployment (QFD)? Download Free Excel QFD Template. In Six Sigma DMAIC, Quality Function Deployment (QFD) is a methodology and tool used in the Define stage.
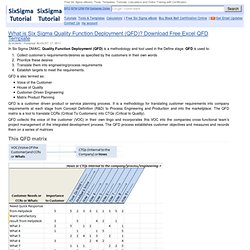
QFD is used to: Collect customer’s requirements/desires as specified by the customers in their own wordsPrioritize these desiresTranslate them into engineering/process requirementsEstablish targets to meet the requirements. QFD is also termed as: Voice of the CustomerHouse of QualityCustomer-Driven EngineeringMatrix Product Planning QFD is a customer driven product or service planning process. Free Quality/Lean Six Sigma Tools hosted by Adaptive BMS.
Software Informer. Decision Analysis and System Dynamics Resources. The bibliographic citation for this book is Craig W.
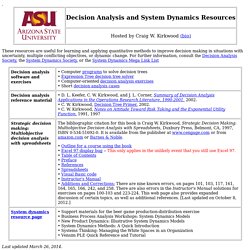
Kirkwood, Strategic Decision Making: Multiobjective Decision Analysis with Spreadsheets, Duxbury Press, Belmont, CA, 1997, ISBN 0-534-51692-0. It is available from the publisher at www.cengage.com or from amazon.com or Barnes & Noble. • Outline for a course using the book • Excel 97 display bug -- This only applies in the unlikely event that you still use Excel 97.
. • Table of Contents • Preface • References • Spreadsheets • Visual Basic code • Instructor's Manual • Additions and Corrections: There are nine known errors, on pages 101, 103, 117, 161, 164, 165, 166, 242, and 258. [meeting1201] Ackoff如何使要被關的廠,不久之後生產力成為世界第一. 95-150.pdf (application/pdf 物件) Shawn Achor: The happy secret to better work. Sheena Iyengar on the art of choosing. Noreena Hertz: How to use experts. Problem Solving and Decision Making (Solving Problems and Making Decisions) © Copyright Carter McNamara, MBA, PhD, Authenticity Consulting, LLC.
Sections of This Topic Include.