
Excel Tutorials. A Pivot Table is way to present information in a report format.
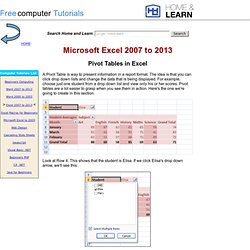
The idea is that you can click drop down lists and change the data that is being displayed. For example, choose just one student from a drop down list and view only his or her scores. Message Board. 5min - Find the best how to, instructional and DIY videos – Life Videopedia. Up next 0:26 0:38 0:41 2:41 0:56 0:46 1:01 1:14 0:56 Caption Languages English.

Getting started. Math Tutorials. FindTheBest.com. Intute - Home. Standard Flowchart Symbols and Their Usage. Basic Flowchart Symbols Flowcharts are the ideal diagrams for visually representing business processes.
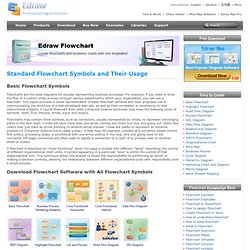
For example, if you need to show the flow of a custom-order process through various departments within your organization, you can use a flowchart. This paper provides a visual representation of basic flowchart symbols and their proposed use in communicating the structure of a well-developed web site, as well as their correlation in developing on-line instructional projects. A typical flowchart from older Computer Science textbooks may have the following kinds of symbols: Start, End, Process, Arrow, input and output.